Chart patterns in forex trading occur when the price of a currency pair moves in a way that looks like a common shape. Some of the common patterns that form are triangles, the head and shoulders, cup and handle pattern, and rectangle pattern.
Chart patterns are a visual way for traders to trade as they provide a logical entry point, a stop-loss level to limit risk, and a price target to ensure profitable exit from a trade.
The cup and handle pattern is a vital chart pattern that has become very popular in the forex trading world. In this lesson we go through what the cup and handle pattern means and how to effectively use it to find trades.
What is the Cup and Handle Pattern?
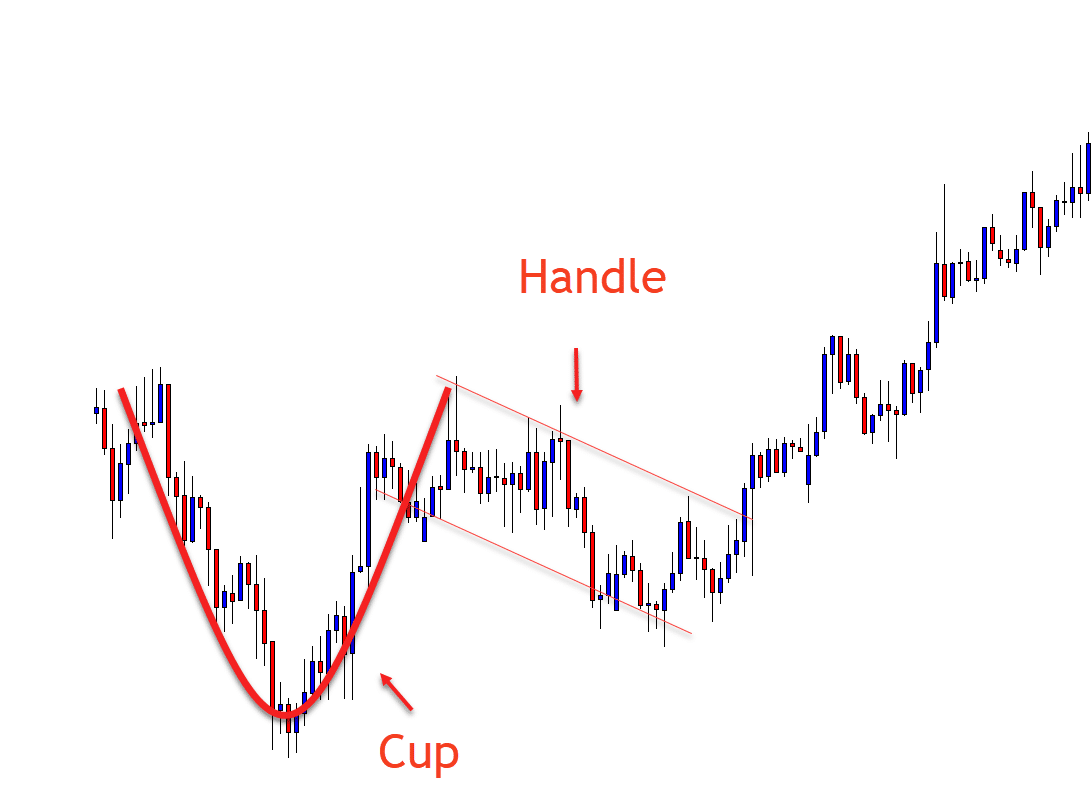
A cup and handle pattern is a pattern used in forex and other financial markets trading. This trading pattern looks like a cup with a handle, with the cup taking the ‘u’ shape and the handle having a slight downward drift.
This chart pattern is considered a bullish signal as the right-hand side of the cup and handle pattern experiencing lower trading volumes. The formation of this pattern usually ranges from seven weeks to 65 weeks, depending on the asset and time frame you are using.
For technical analysis, the cup and handle pattern can be seen on small time frames (1-minute chart) and on longer time frames (daily, weekly, or monthly charts). The cup and handle pattern usually occurs when there is a decline in the price of an asset, followed by a stabilizing trading period, and finally, a rally that is approximately equal to the earlier decline.
The pattern creates a U-shape or the “cup.” The price of the asset moves sideways or drifts downwards within a set channel. Thus, forming the handle. The handle can also be the shape of a triangle.
The handle in this chart pattern has to be smaller than the cup, and it shouldn’t down into the lower half of the cup shape. Ideally, the handle should stay in the upper third of the pattern. The cup and handle pattern tells a trader either the market is experiencing a reversal or a bullish continuation.
A reversal takes place when the price of the asset is in a long-term downtrend before forming a cup and handle that reverses the downward trend, and the price starts going up. Meanwhile, a continuation pattern takes place during an uptrend. The price of the asset is rising, a cup and handle pattern is formed, and the price continues to rise.

How to Properly Identify the Cup and Handle Pattern?
As a trader, if you want to identify a cup and handle pattern, you need to follow the price action of an asset on a chart. The cup and handle pattern begins to take shape when there is a sharp decline in the price movement of a forex currency pair over a short period.
This event is followed by another period where the price stabilizes. Finally, there is a rally in the price of the asset to equal the initial decline or surpass it. The movements by the asset forms a ‘u’ shape on the chart, which is also called a cup.
After the price of the asset hits the top of the cup, it begins to move sideways or slightly downwards, forming a handle in the process. However, if the handle goes below the lower half of the cup, then the pattern is no longer a cup and handle. The handle isn’t supposed to go below the top third of the cup as it would make it lose its cup and handle pattern.
How to Easily Trade the Cup and Handle Pattern?
To trade the cup and handle pattern, there are three necessary steps for you to take;
Enter the Cup and Handle
To start trading, you need to wait for a handle to form.
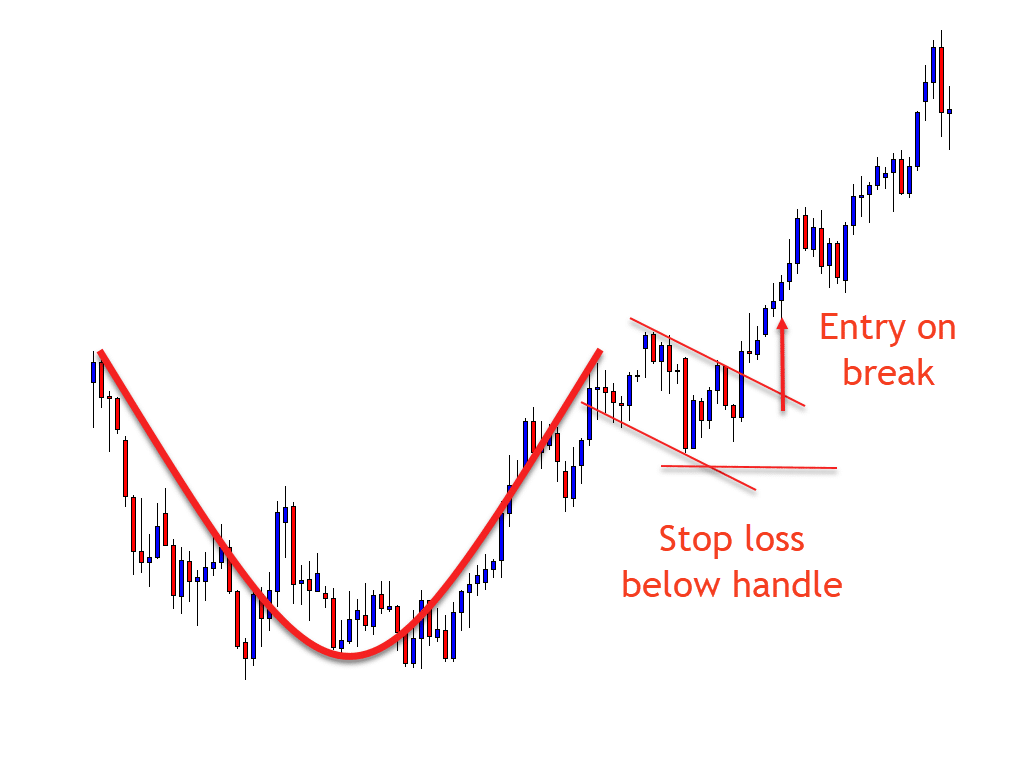
Once the handle is complete you can look for a long trade entry when price breaks out and moves above the top of the handle. When price surpasses the handle, the cup and handle pattern is complete, and the price is expected to increase. Although it is expected to rise, that doesn’t mean it always will. This is the reason why you need to set up a stop-loss to limit the potential losses.
Setting a Stop Loss
The stop loss order helps limit the losses of a trade. If the price of an asset doesn’t rise after buying a breakout from the cup and handle formation, the stop-loss helps control the risks on the trade.
The simplest stop loss point for this pattern is below the other side of the handle. See the example below.

Setting a Profit Target
The third and final point is to select a profitable exit or profit target.
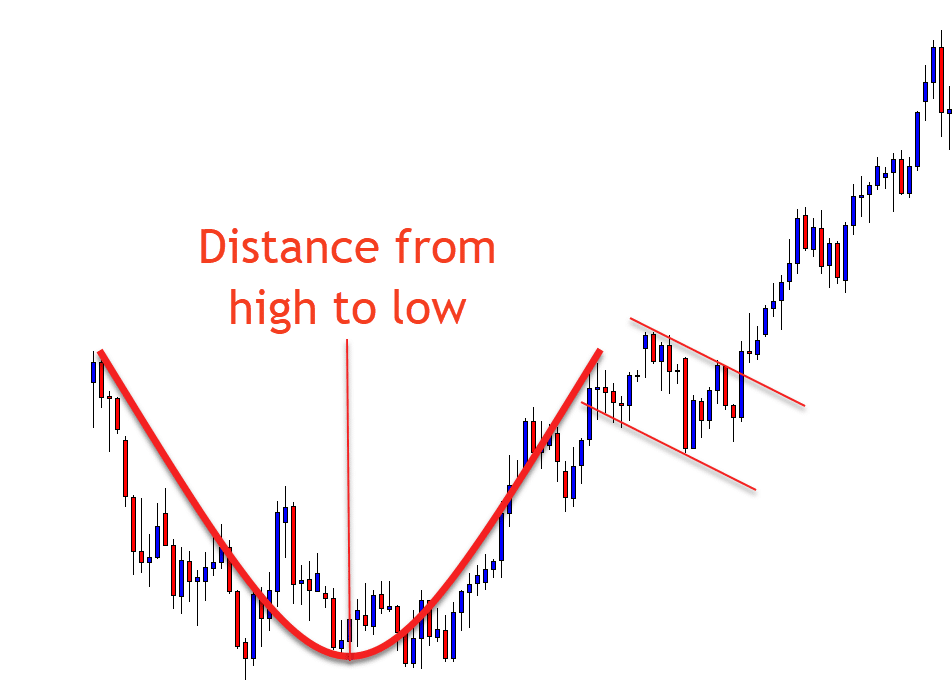
To determine this, you should add the height of the cup to the breakout point of the handle. The figure obtained from this calculation is the target or the exit point.
In some instances, the left and right sides of the cup may have varying heights. When that happens, use the smaller height and add its figure to the breakout point to generate a conservative exit point or target. You can also use the bigger height if you prefer to get an aggressive target. As a day trader, if you don’t reach the target by the end of the day, it is best to close the position before the end of the trading hours.

What is the Inverted Cup and Handle Pattern?
The inverted cup and handle pattern is simply the inverse or ‘upside down’ cup and handle pattern.
With the standard cup and handle pattern, you can see a distinct ‘u’ shape and a downward handle, indicating a bullish continuation.
The inverted cup and handle pattern is the opposite and shows bearish intent. Instead of getting the ‘u’ shape, you will see an ‘n’ shape, with the handle bending slightly upwards on the chart.
An inverted cup and handle pattern is a chart pattern that shows you that a new move lower could be just around the corner. You can use this pattern as a sell signal to make short trades.


Leave a Reply