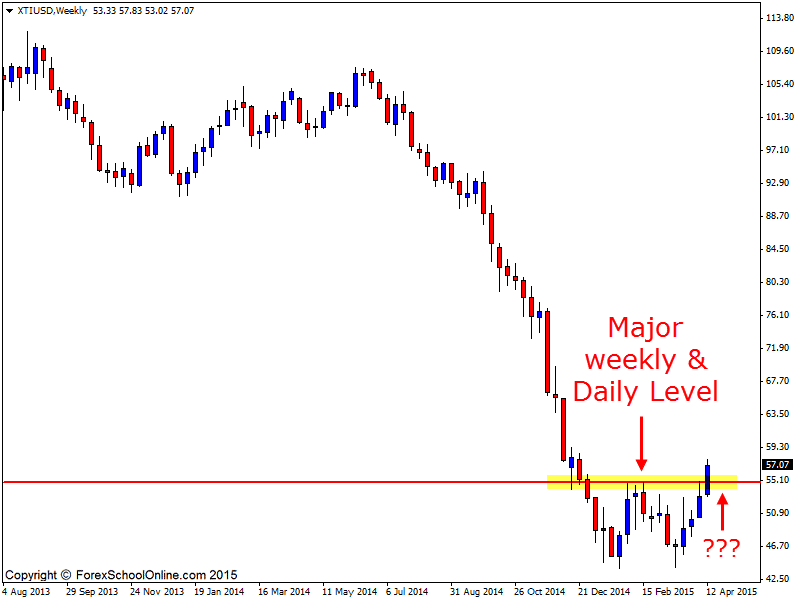
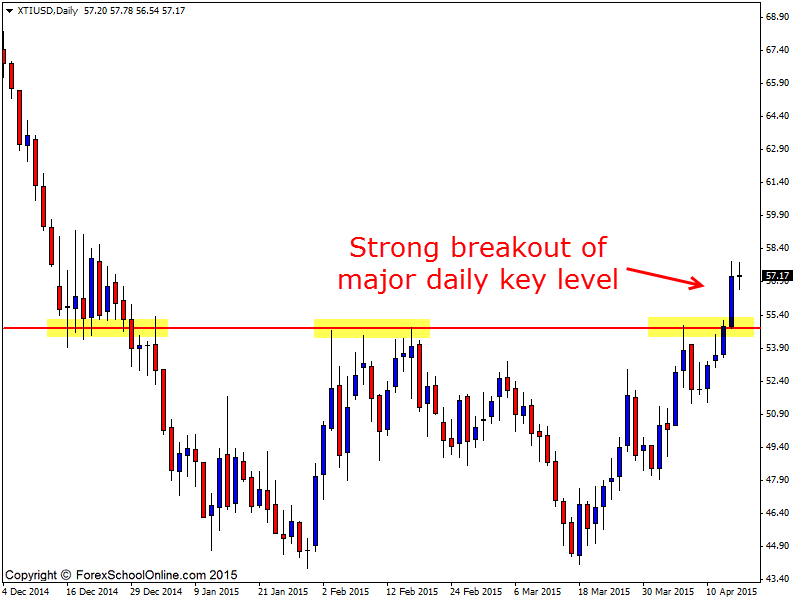
Crude Oil or West Texas Intermediate (WTI) has smashed higher and most importantly closed above a major daily resistance level on the back of a 1,2,3 trend reversal pattern. Before this strong move back higher, price had been in a heavy down-trend for some time with price being sold off heavily from highs of around 107.00 in January 2014 to lows of 44.00 just recently which is obviously some sort of sell off.
Oil is a market that has massive consequences right around the world for many countries and companies with the price having huge ramifications depending on which way it goes and with it being so low at the moment the smaller companies can tend to struggle.
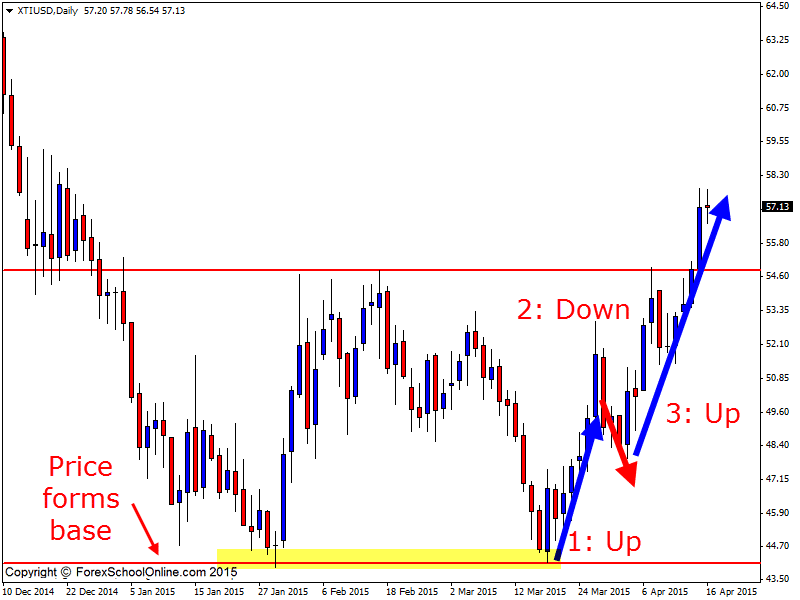
As the second daily chart shows below; for price to make this move higher it first formed a base. This is often the case with reversals in the markets and something you can start to watch out for to try to get into reversals earlier than others. Price will form a really solid base with a double high or double low for example. It is extremely rare that price will just reverse all of a sudden on the spot.
On this same chart I have shown how price has formed the 1,2,3 trend reversal pattern. The 1,2,3 is a high probability short-term price action pattern that can help you identify short-term trends and when you line them up with the major levels you can then hunt really high probability price action trades. I discuss and teach how to trade with the 1,2,3 trend reversal pattern here;
Trading Price Action in a Trend With the 1,2,3 Trend Reversal
Now that price has broken this major weekly and daily level it could look to just continue higher or it could make a quick retrace back lower. If price does retrace back lower, then you could look for high probability trade setups at the old resistance level that price busted through on the daily chart. You can look for this old resistance to act as a price flip and new support level. For any potential trade setups you would need to see high probability trigger signals like the ones taught in the Forex School Online Members Price Action Courses.
It is important that you watch the price action behavior to make sure that the new support level holds and price remains above the old resistance/new support. If price does just continue it’s move higher, you can start to look for long trades with the new short-term trend higher by waiting and watching for price to make any quick retracements back into value areas and then pouncing. Check out the lesson I show you on how you can do that here;
Trading High Probability price Action From Value Areas
Weekly Chart

Daily Chart

Daily Chart


Leave a Reply