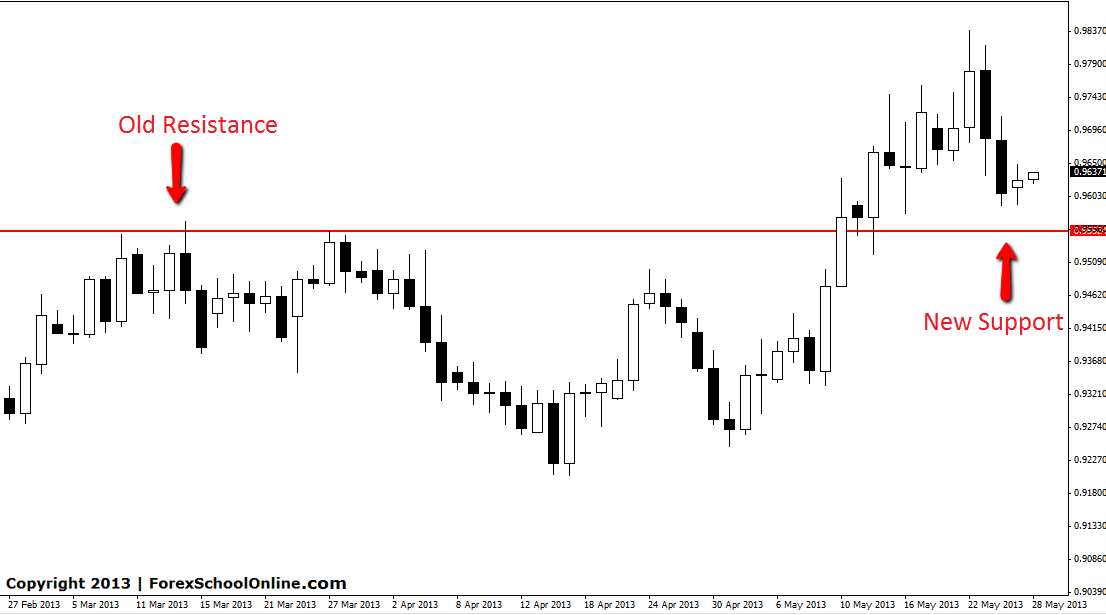
The daily chart of the USDCHF shows price is moving lower and getting closer to what could be a critical support level for this market. This level was old resistance with price not able to break through and move higher. Once price broke higher through resistance it moved onto new highs and we are now looking for the same level to hold as new support should price retrace back lower.
The recent trend is higher with price breaking out and making fresh highs. Taking long trades would be the preferable play in this pair whilst price is above this critical level and whilst price is making fresh higher highs and lows.
Traders could watch their 4hr, 8hr, 12hr & daily charts at the support level marked on the chart below to get long if any solid price action opportunities present. If you are wondering how you can make different time frames on your MT4 charts read here: Make Any MT4 Time Frame
USDCHF DAILY CHART | 28TH MAY 2013


Leave a Reply