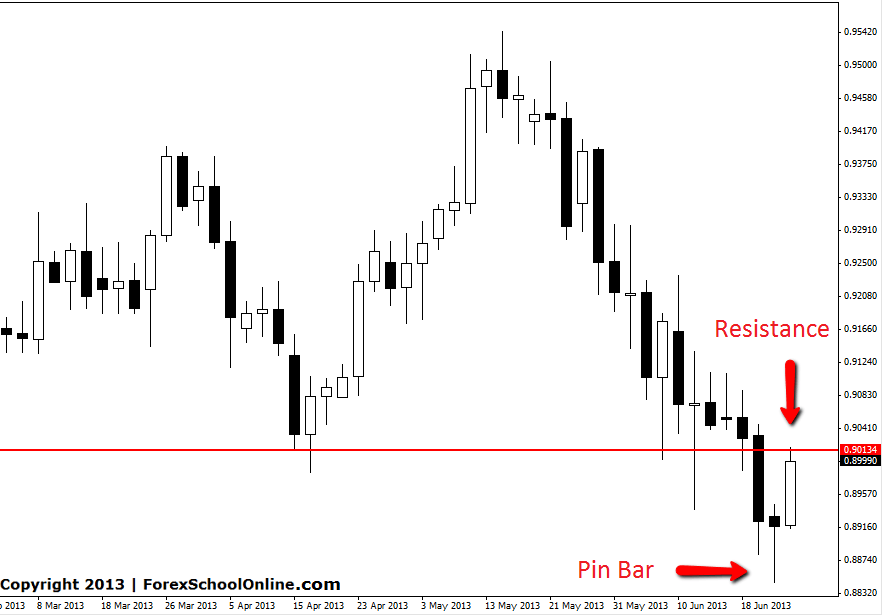
The CADCHF has boomed higher after forming a counter trend Pin Bar on the 2 day chart. This Pin Bar was straight against the very strong down-trend, but it was down at the low like all good pin’s are and it also stuck out away from all other price.
Once price broke the high of the Pin Bar it move higher dramatically and into the near term resistance level. For the brave traders who are happy to take counter trend trade trades, this moved higher and gave them a chance to get their capital protected quickly in this trade by moving their stops into break even or taking profit off the table.
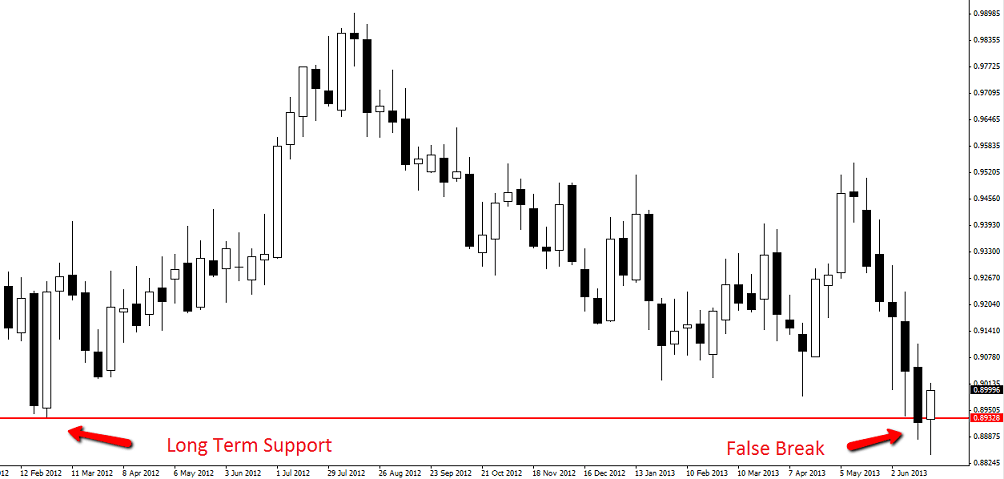
The counter trend move has now created ripples on the weekly chart. The weekly chart of this pair now shows that price has created a false break off a longer term support level. Price has now got to negotiate a resistance level but this weekly false break could be hinting at higher prices if this resistance level can be broken in the coming weeks.
CADCHF 2 DAY CHART | 27TH JUNE 2013

CADCHF WEEKLY CHART | 27TH JUNE 2013


Having read this I believed it was extremely informative.
I appreciate you finding the time and effort to put this short article together.
I once again find myself personally spending a significant amount of time both reading
and leaving comments. But so what, it was still
worth it!