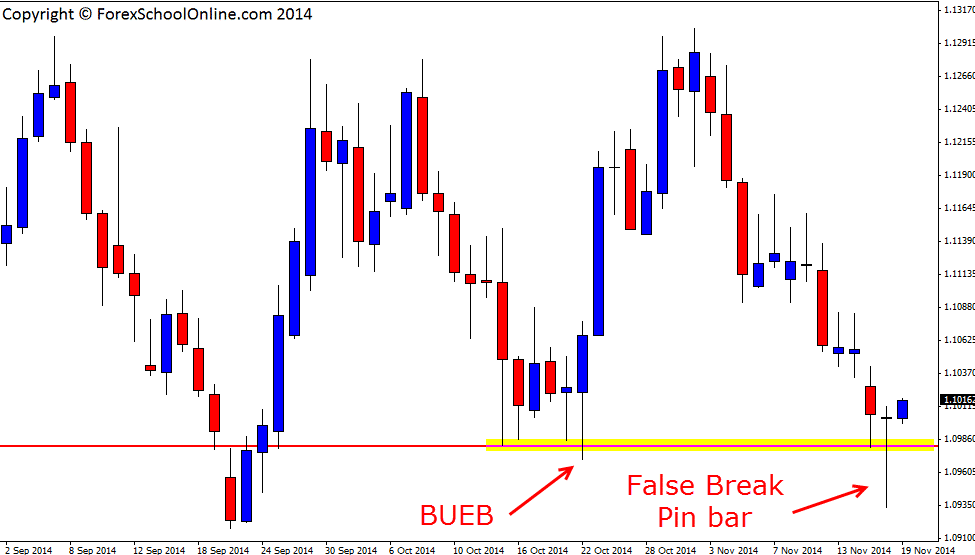
The AUDNZD has printed off a False Break Pin Bar on the daily price action chart. This false break pin bar is down at a swing low and protruding through the recent support area where price had recently held and fired off a large Bullish Engulfing Bar (BUEB). Price has recently been trading in a very clear sideways pattern. Price had made a triple top with price on the last rejection making a higher high before falling lower and into this support area where price sits now.
For this false break to break higher and make a substantial move, price would need to confirm the setup and break the pin bars high. As I discuss in the trading tutorial Taking High Probability Price Action Entries at the Break these sorts of price action trigger signals need to be taken with momentum to increase their probability. With the false break we can see that price tries to fake out the market by moving below the support level. This gets the breakout traders entering into short trades because they think that price has broken the support level and so they start entering into short trades. All of a sudden price snaps back higher and all of these short traders are left in their trades with price moving against them. As price moves higher the breakout traders begin to have their stops taken out or they bail out themselves and this adds fuel to the fire for price to move back higher. This is normally why false break moves are quick and aggressive; they are eating stop orders for fuel.
From here there looks to be a close first resistance overhead. If price can break higher and move into this level, then traders would need to be mindful that this market has been very rangy of late. If price moves back lower, the first support comes in at the level the pin bar is rejecting and then around the 1.0920 level.
AUDNZD Daily Price Action Chart – False Break Pin Bar
Related Forex Trading Education
– *Live* False Break Pin Bar Trading on the Daily Chart – Video


Leave a Reply