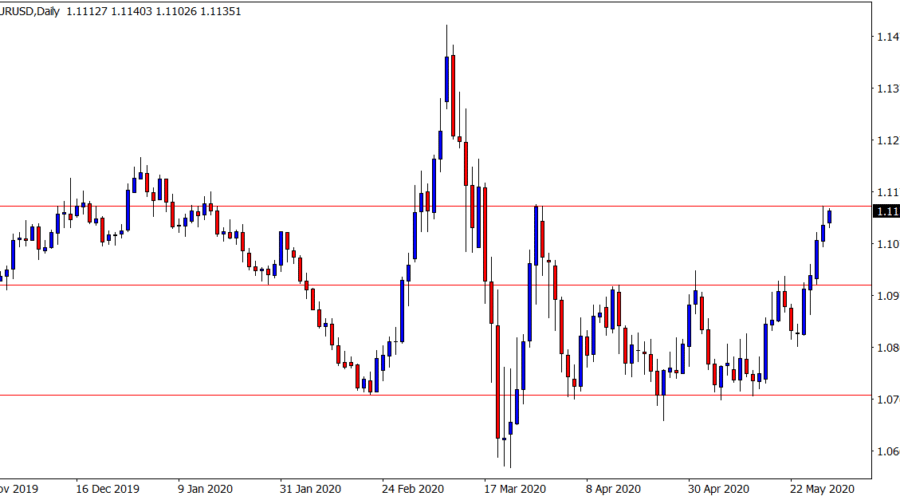
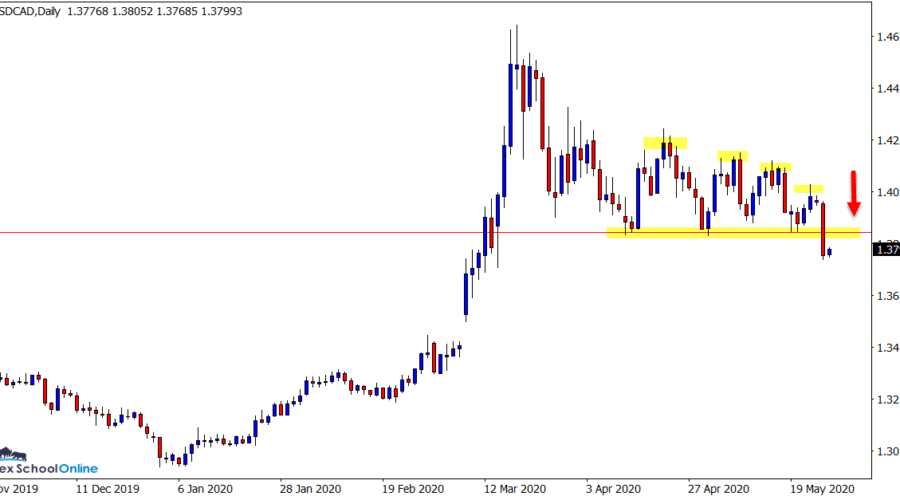
Weekly Price Action Trade Ideas – 1st to 5th June 2020 Markets Discussed in This Week’s Trade Ideas: EURUSD, USDCAD, USDSGD and SILVER. Note: We Use Correct ‘New York Close 5 Day Charts’ – You can read about why we use these and how to download the correct free charts at Correct Free …
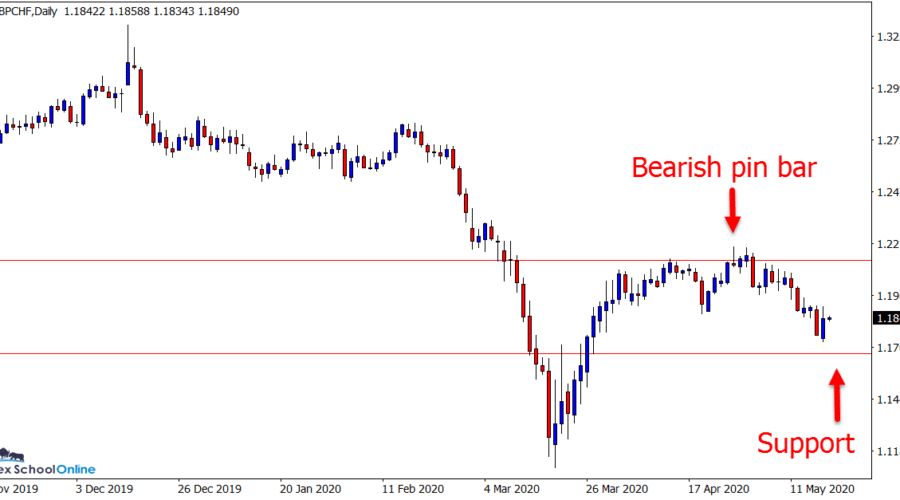
Weekly Price Action Trade Ideas – 27th May 2020 Markets Discussed in This Week’s Trade Ideas: EURUSD, USDCAD, GBPCHF and NZDJPY. Note: We Use Correct ‘New York Close 5 Day Charts’ – You can read about why we use these and how to download the correct free charts at Correct Free New York …
Weekly Price Action Trade Ideas – 19th May 2020 Markets Discussed in This Week’s Trade Ideas: USDCAD, GBPUSD, EURAUD and GBPCHF. Note: We Use Correct ‘New York Close 5 Day Charts’ – You can read about why we use these and how to download the correct free charts at Correct Free New York …


