Charts in Focus Weekly Summary – 4th Sep
Markets discussed today; USDCHF, EURAUD, AUDCHF & NZDJPY.
Note: We Use Correct ‘New York Close 5 Day Charts’ – Download Free New York Close Charts Here
USDCHF DAILY CHART
Rewards Versus Risks
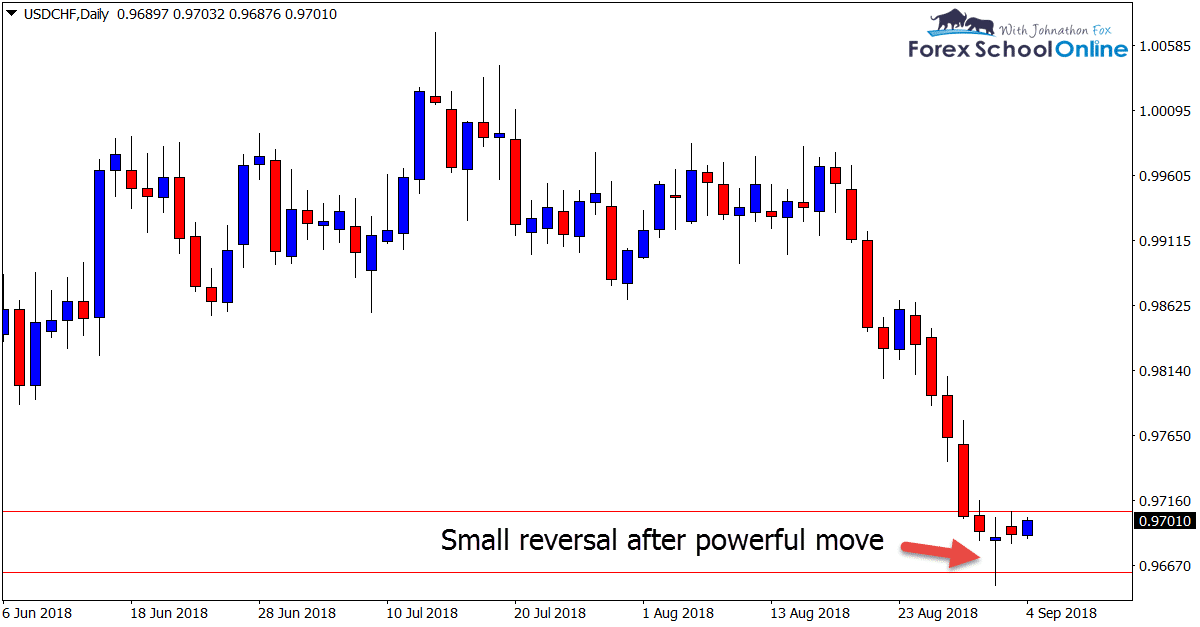
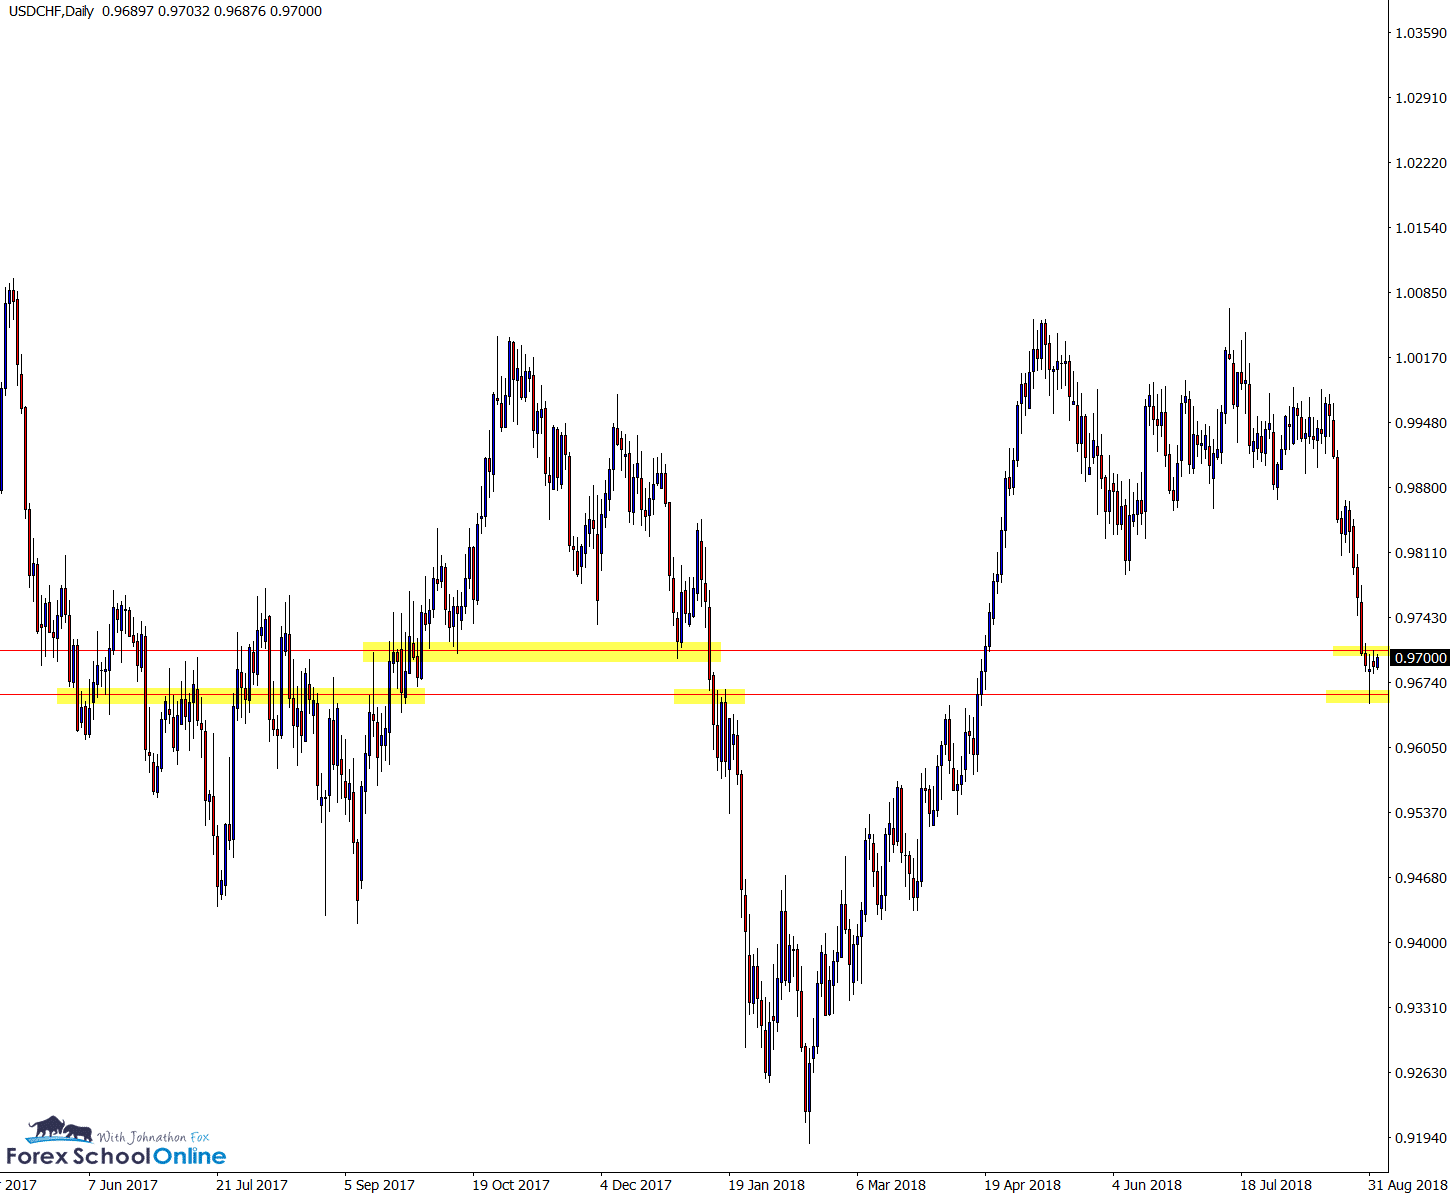
Price on the USDCHF has formed a smallish bullish rejection candle after selling off aggressively lower.
This small bullish rejection is formed at an important support level that goes back quite a way, however; before this rejection of support we can see price had moved with large and aggressive selling lower.
As we discuss in the ‘How Professionals Stop Hunt’ lesson, these small rejection candles will often form after a large move higher or lower as a way for the market to take a breather.
The portion of the market who has made a profit will often cash in these profits and the selling pressure can become less, causing a sideways and rotation move back into value.
When making trades against strong moves or momentum we can often be sucked into small pin bars because they look like they have a lot of space to move back into. However; often when the profit taking has finished, the market will continue in the same direction it was already moving.
Yes, these do work out on occasions because quite often they are at support or resistance, but we must pay attention to the overall market story and work out whether the rewards we could potentially receive from the trade is worth the risk in playing it.
EURAUD DAILY CHART
Potential Stall, Break and Run
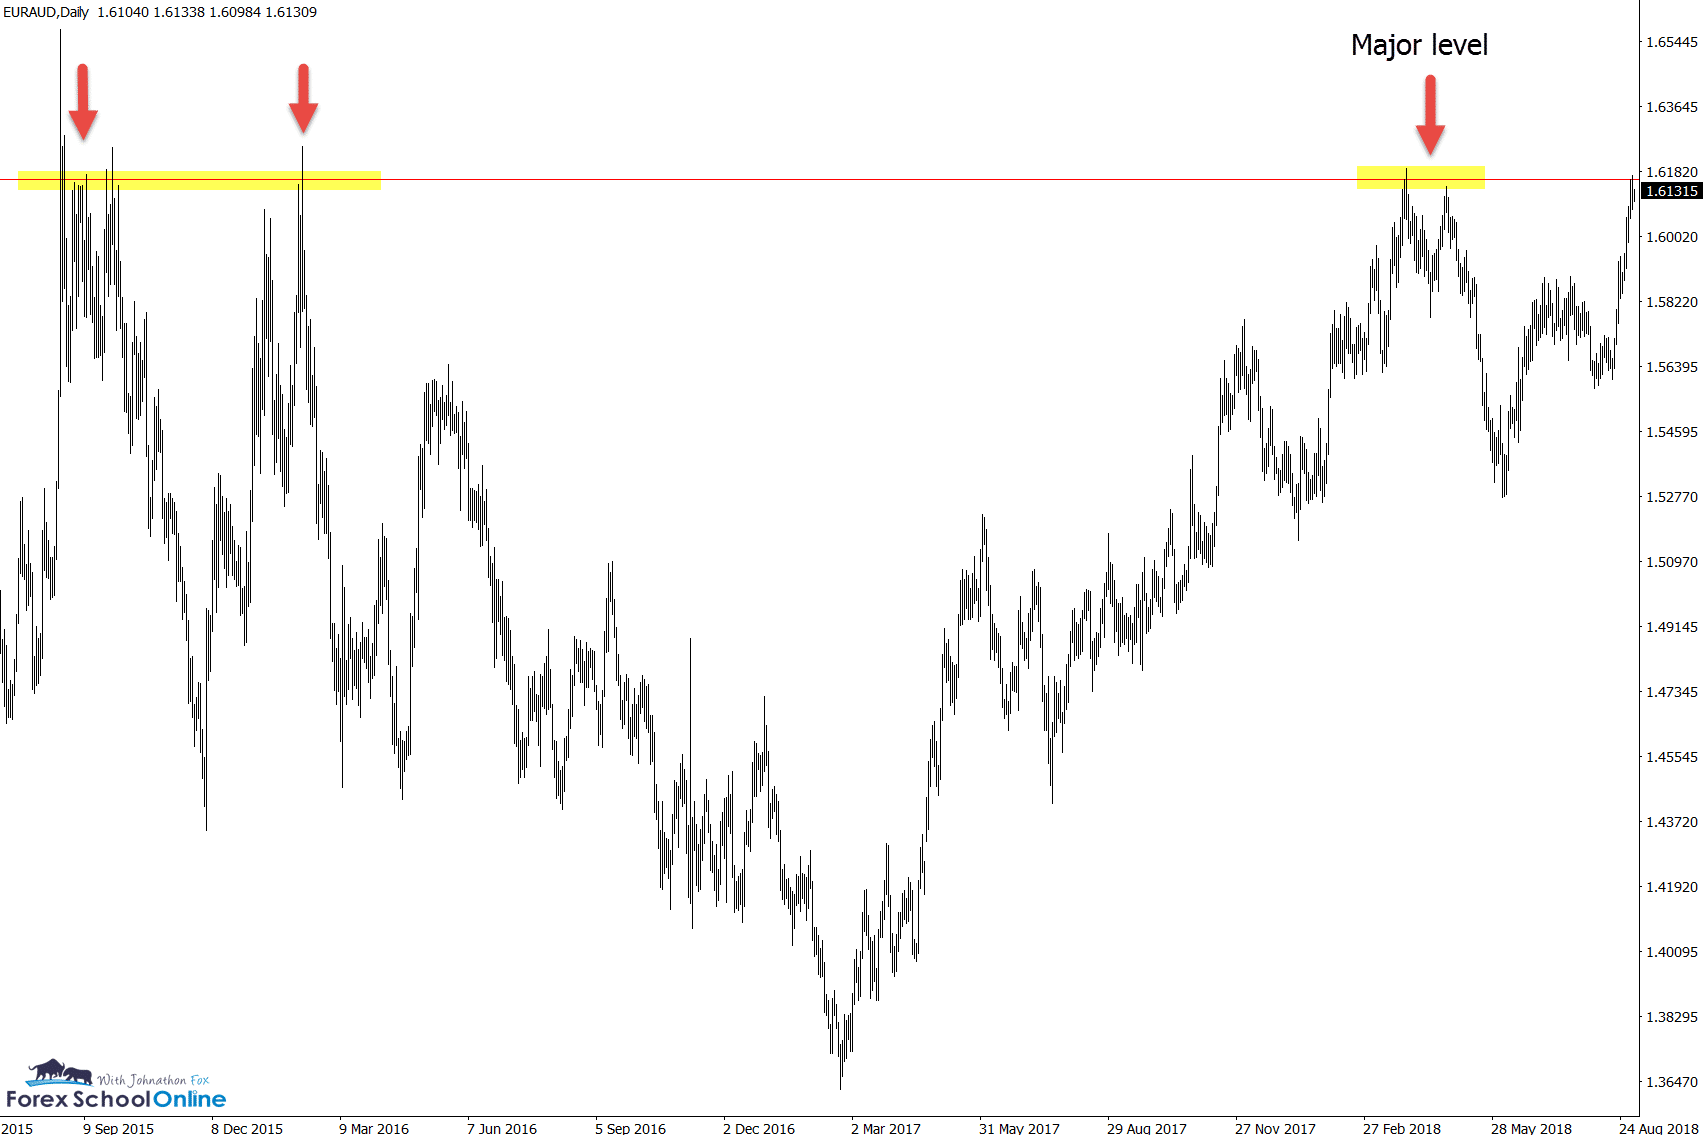
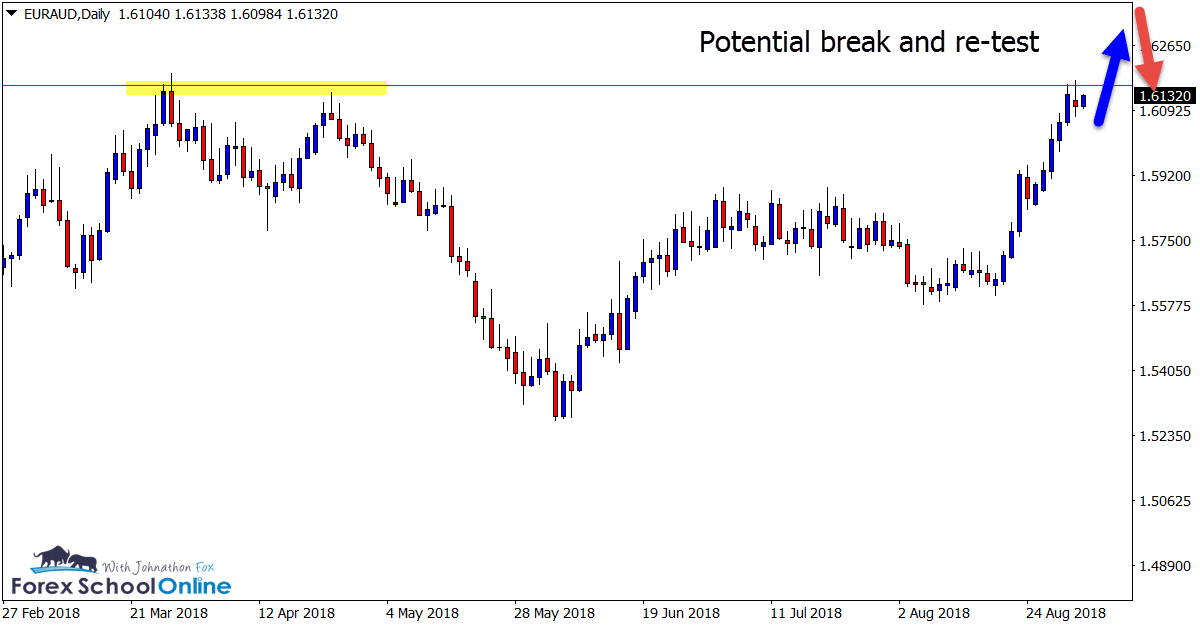
On the flip side we can see price has run higher quickly on the EURAUD before stalling at a major resistance level.
This level is a proven area of resistance that you will note on your daily charts.
Whilst solid trades could be found selling short, if price can break and close higher through this level, then there is a lot of room for price to quickly run and move higher into.
AUDCHF DAILY & WEEKLY CHARTS
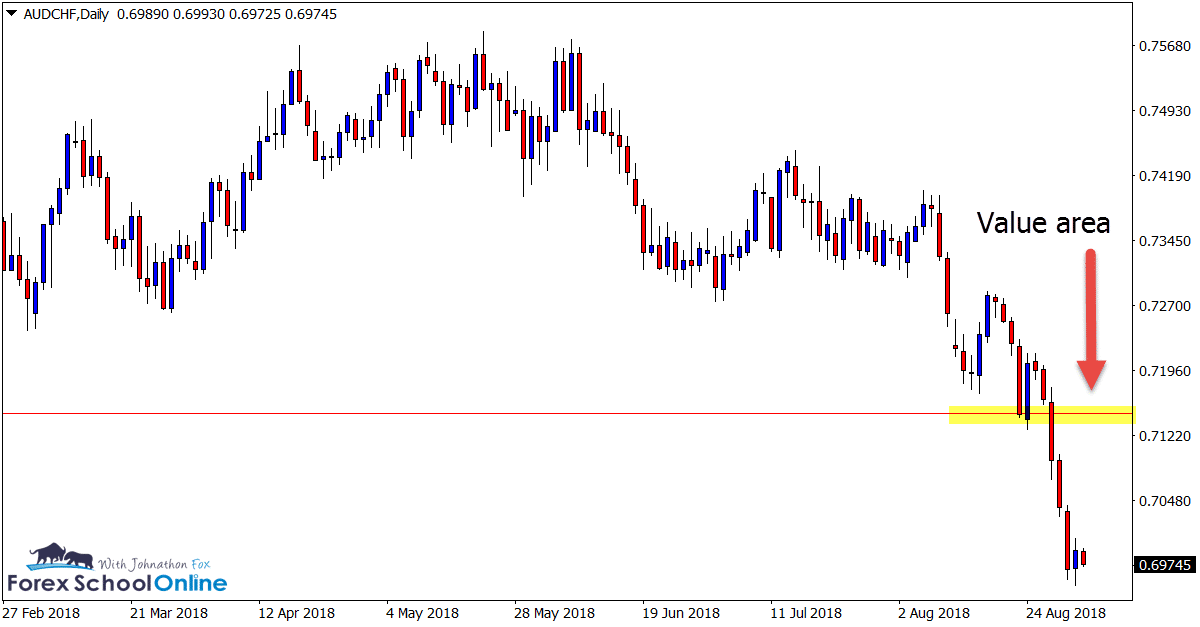
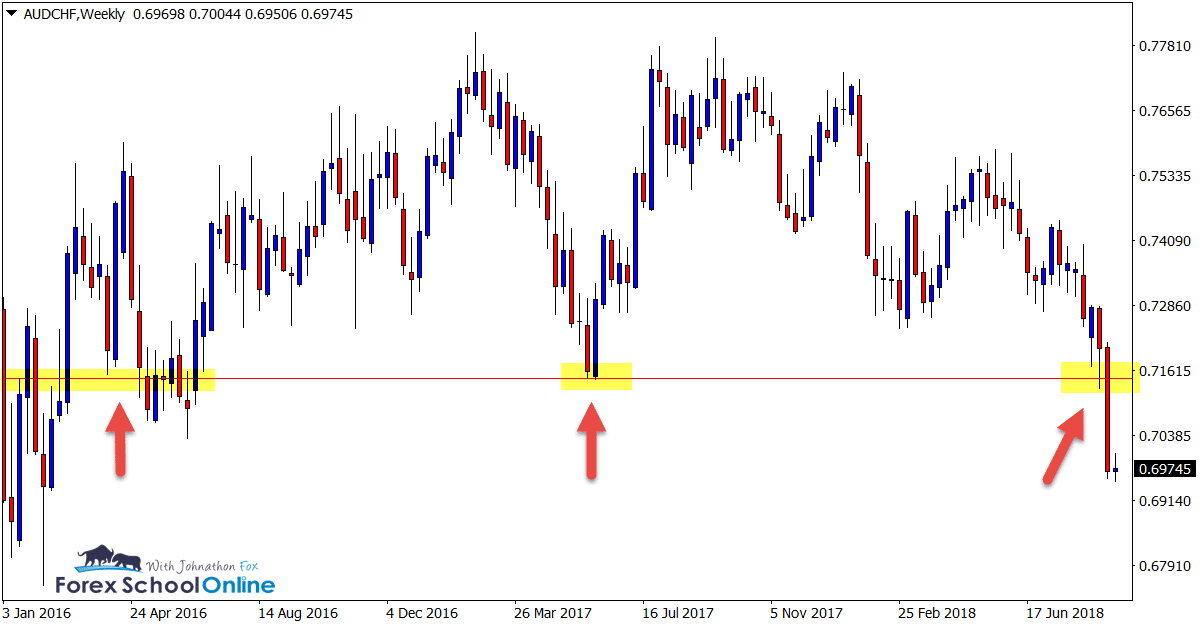
Break and Re-test
After price popped higher and bounced from the major support level in this market, it quickly reversed and smashed through the same level closing strongly below it.
As both charts show below; the sell-off has been extreme over the past week and the major daily level could act as a major re-test and value area, should price rotate higher and make a test of the old support and potential new resistance.
NZDJPY DAILY CHART
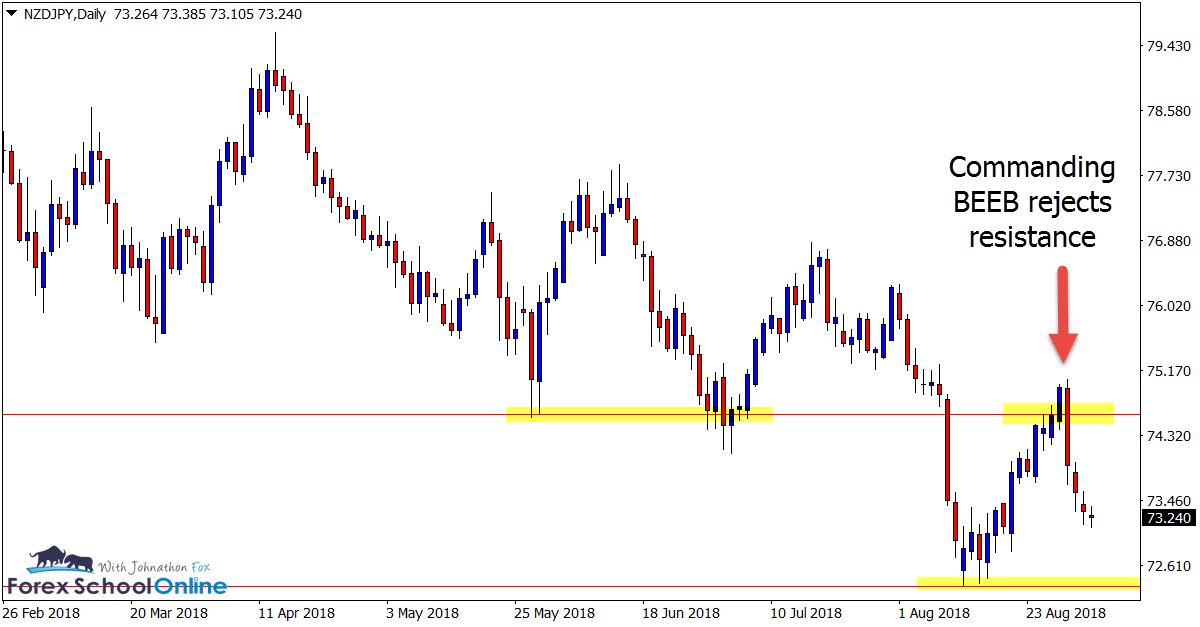
Commanding Bearish Engulfing Bar = BEEB
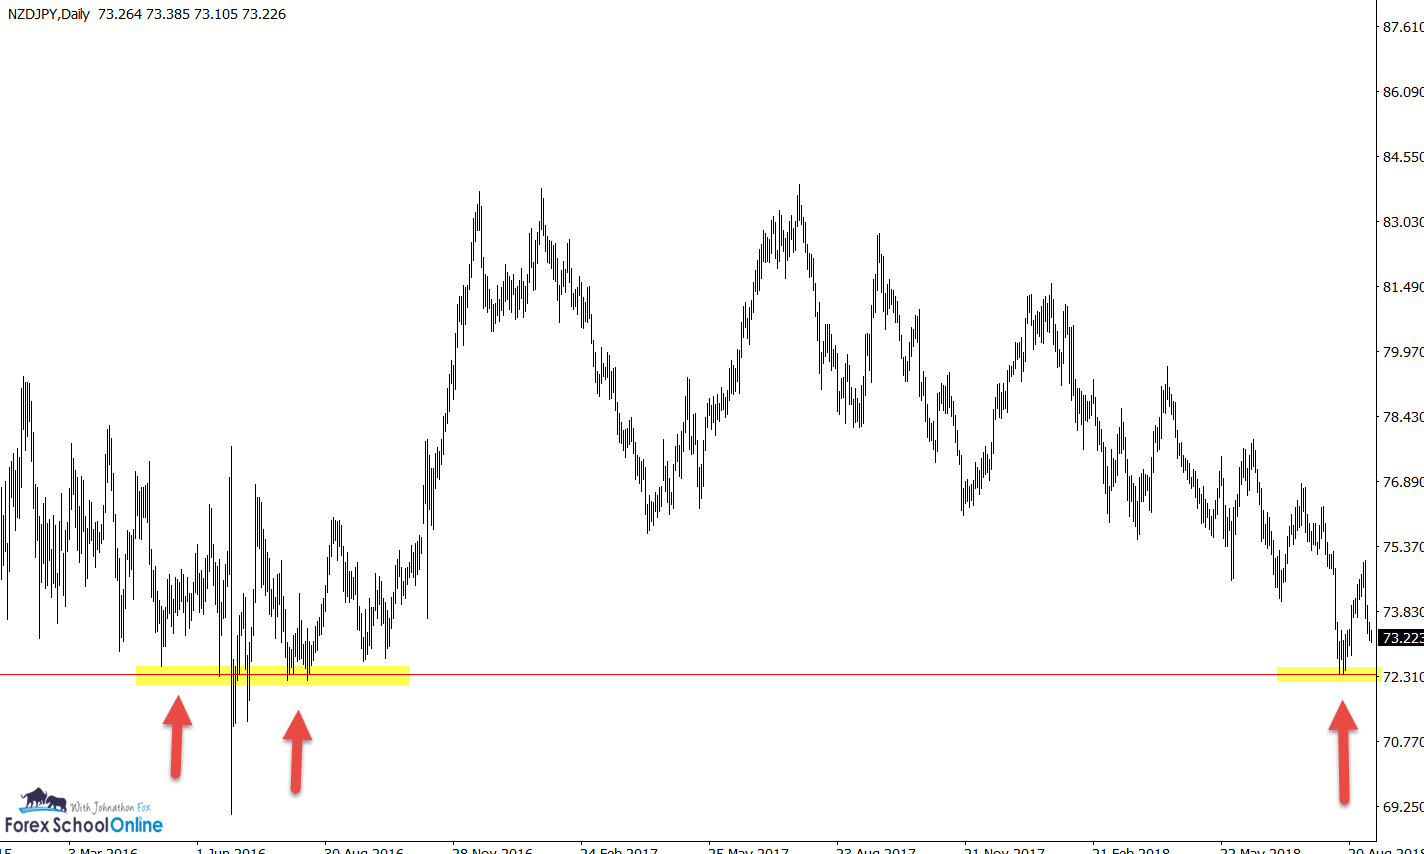
Price on the NZDJPY moved into a nice swing high where we can see on the daily charts price had acted previously as a support level.
After rotating into this level and making a test of the new resistance, price smashed lower with a strong close, forming a Bearish Engulfing Bar = BEEB.
Note how the candle on the BEEB closed strongly towards the bottom ⅓ of the candle indicating that the sellers were still in control when the engulfing bar closed.
If price can continue to move lower the next major support comes in around the 72.35 area.
Charts in Focus Note: All views, discussions and posts in the ‘charts in focus’ are the view of Forex School Online and are not recommendations or trading advice. All posts are general in nature and are not advice to buy or sell.


hey sir
i found it and it is so amazing and easy to understand it and thanx for ur helping me and gud blezz u sir
dalia
Hi Dalia,
checkout / search for all of those answers and more that are discussed; https://www.forexschoolonline.com//blog/
Johnathon
Thank you much for your help, I enjoy much your analysis.
hey sir
i like ur post and i like use larger frame times and i hear swing traders use weekly for chartig and daily and four hours for trading by entry i ask u plz if u ok
1 what u use frame times for swing trading charting and trading by entry ?
2 do u use technical only or fundametnal both ?
3 how to use swing trading with fundamentals ?
thanx
Thank you Jonathon! Always look forward to your weekly view on the markets! Helps tremendously!
Good to hear from you Bob and glad you enjoyed it!
Johnathon
Hi Johnathan,
Once you get the pinbar signal on the daily NY close, do you take the Trade soon after or do you wait for London open or even NY open?
Also would you enter in the lower timeframe (H1 or H4)?
Thanks
Prabha
Hi Prabha,
have a look at the following two lessons and let me know if any questions;
– https://www.forexschoolonline.com//are-your-entries-blowing-up-your-trading-account-high-probability-price-action-entries/
– https://www.forexschoolonline.com//manage-forex-trades-using-key-price-action-time-frames/
Safe trading,
Johnathon
Good morning Jonathan. It has been so refreshing to look at the charts from a completely new angle and without all the busy indicators. I can the PA so much more clearly. I really hope that I can learn and walk towards success eventually.
I am not glued to the pc all day anymore and I feel much more relaxed and all my stress has gone out the window. Thank you.
Heya Prava,
demo, back-test and continue testing until you prove you can make money.
Safe trading,
Johnathon
Great analysis Johnathon!
Thanks and good to hear from you Gary.