EURAUD DAILY & 4 HOUR CHARTS Price on the daily price action chart of the EURAUD has broken lower and is now between a major daily support level and a potential 'Kill Zone' overhead. This is an interesting chart. Unlike price on the other pairs that I will discuss further down (especially …
Price Action Charts in Focus
Inside Bar Sends AUDNZD Retracing Into Potential ‘Kill Zone’ | 14th June 2016
Price is now looking to try and move higher, potentially making a re-test of the price flip resistance level on the daily price action chart, after breaking the high of the inside bar. As the chart illustrates for you below, price paused and formed the inside bar after breaking out lower, through …
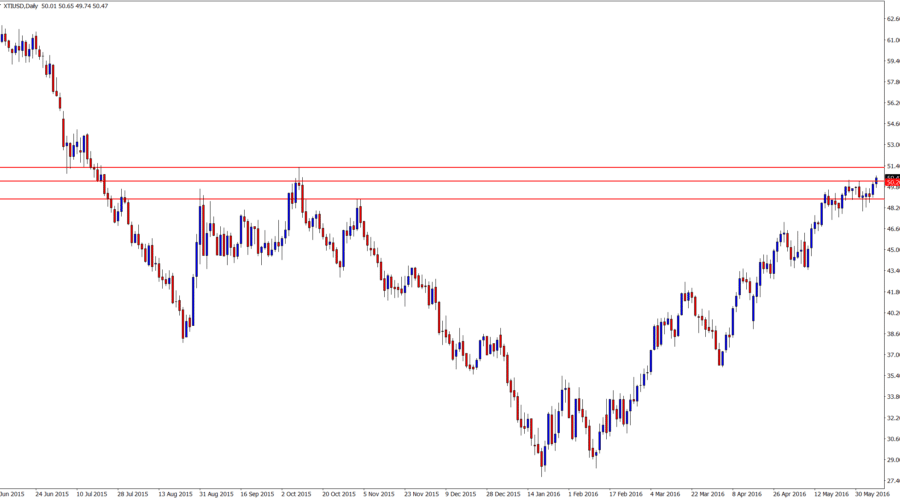
Oil Attempting Breakout on the Back of ‘Double Inside Bars’ on 1 Hour Chart | 7th June 2016
As I write this 'Charts in Focus Daily Summary' for you, price in the Oil v USD market is attempting to breakout higher and through a major daily resistance level. Price on the daily chart has been moving higher, creating a strong momentum and fresh upward trend. As my daily chart illustrates for …


