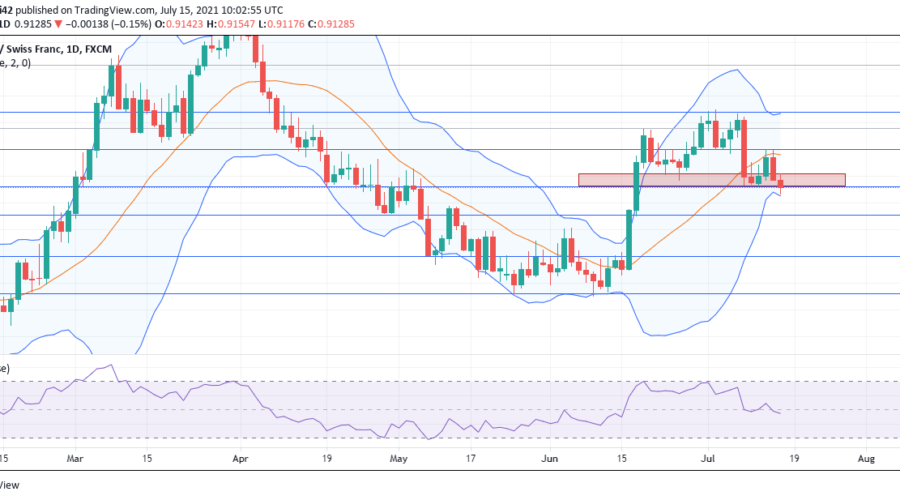
Market Analysis – USDCHF Fails to Bypass the 0.92000 Resistance USDCHF fails to continue the bullish movement and presents a tweezer top candle formation to go lower. The market has similarly presented a tweezer top candle formation at 0.92400 supply level on the 18th of June 2021. What followed …
Price Action Charts in Focus
GBPJPY Bears Put Pressure on the Market
GBPJPY Analysis – Bears Push Down Hard Against the Market GBPJPY bears have systematically taken over the market and are increasingly pushing hard against the market. The market entered the month of February 2021 on a bullish run. The momentum of prices was gradually reduced starting from the 24th …
EUR/JPY Is In a Downtrend, Targets Level 125.97
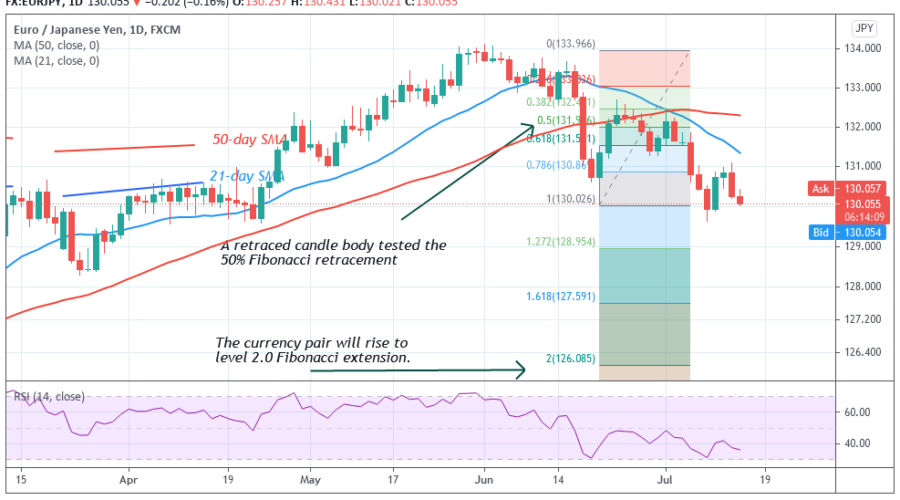
EUR/JPY Long-Term Analysis: BearishEUR/JPY is now in a downtrend. The currency pair faced rejection at level 134.00 and it retraced to level 133.00. After a retest at level 133.50, the market declined to level 130.00 and corrected upward. The selling pressure will persist as price breaks below the …


