Weekly Price Action Trade Ideas – 25th Feb to 1st Mar 2019 Markets Discussed: EURUSD, GOLD, GBPCHF and AUDSGD EURUSD Daily Chart Pin Bar at Range Low - Price Moves Into Mid-way Point Price action on the daily chart of the Euro has been stuck inside a sideways ranging box for many …
Price Action Charts in Focus
Weekly Price Action Trade Ideas – 17th to 22nd Feb 2019
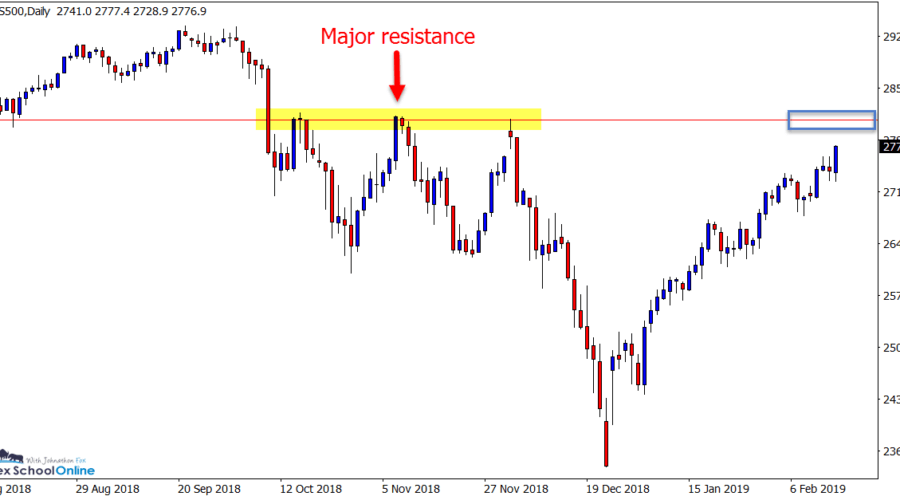
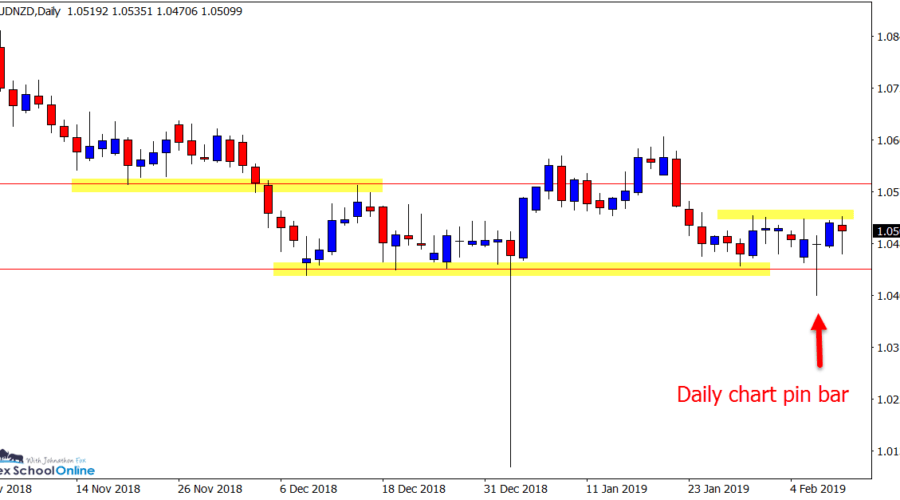
Weekly Price Action Trade Ideas – 17th to 22nd Feb 2019 Markets Discussed: AUDNZD, GOLD, OIL v USD and S&P 500 AUDNZD Daily Chart Price Hits ‘Trouble Area’ and Collapses Price this week has collapsed lower and through what looks to be a crucial support level on the AUDNZD daily …
Weekly Price Action Trade Ideas – 10th to 15th Feb 2019
Weekly Price Action Trade Ideas – 10th to 15th Feb 2019 Markets Discussed: AUDUSD, AUDNZD, GBPCHF and OILvUSD AUDUSD Daily Chart Huge Sell Off From Daily Resistance Price action on the Aussie this week saw price make a huge sell-off, rejecting the daily resistance level and moving back …


