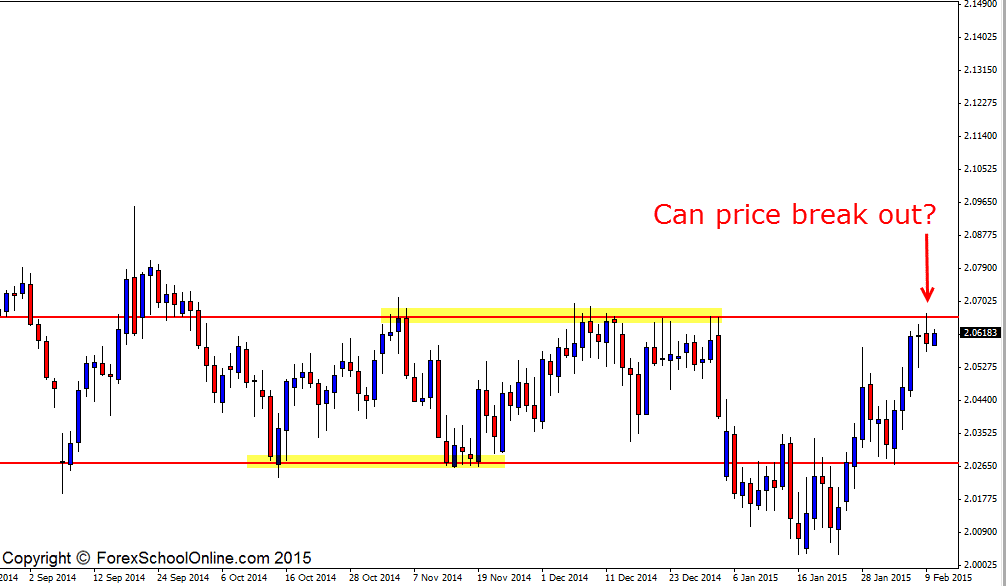
The GBPSGD as I write this is trying to bust out higher and through the high of the major daily resistance area. Price in recent times has been caught in a clear range and sideways trading period with a clearly defined high and clearly defined low as the daily chart shows below. At the moment price is trying to bust through the high of the resistance.
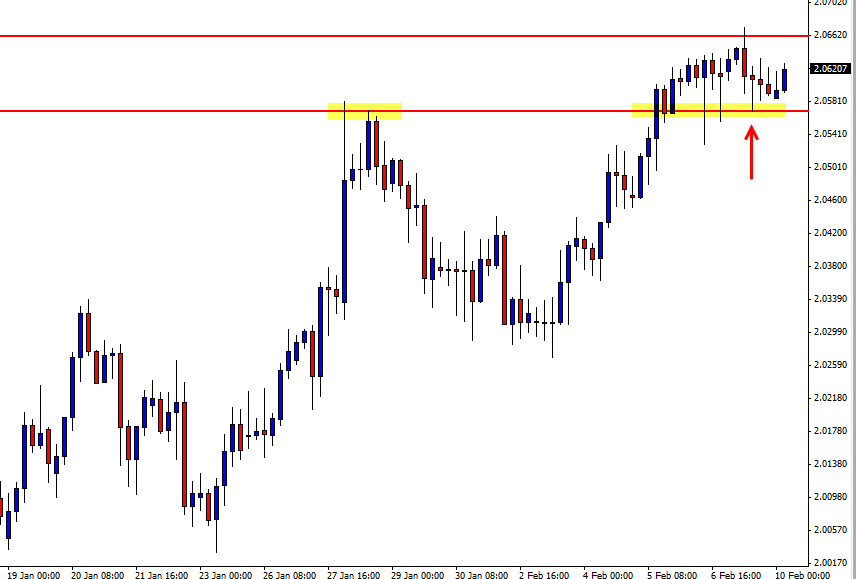
When price first moved up to this resistance it was met with from the bears as was to be expected. As the 4 hour chart shows below; the bears/sellers jumped in as soon as price touched this resistance level and price formed a Bearish Engulfing Bar (BEEB) on the 4 hour chart showing that there was some selling order flow still remaining at this area.
The major problem with these range and sideways markets is that because they are not making clear moves, they are chopping up and down and creating a lot of traffic or minor support and resistance areas and if price is to trade back into these areas it means it will once again have to pass back through these traffic/support or resistance areas. After breaking lower below the 4 hour BEEB, price was trading straight back lower and into one of these minor support trouble areas and that is where price found support and has since moved back higher from.
If price can now break higher and through the major daily range high it could present traders with a solid opportunity to look for long setups with the new momentum should the old range resistance be able to act as a price flip and hold as a new support area.
GBPSGD Daily Chart

GBPSGD 4 Hour Chart

Related Forex Trading Education
– The Only Way to Win at Forex is to Swim Against the Stream


Leave a Reply