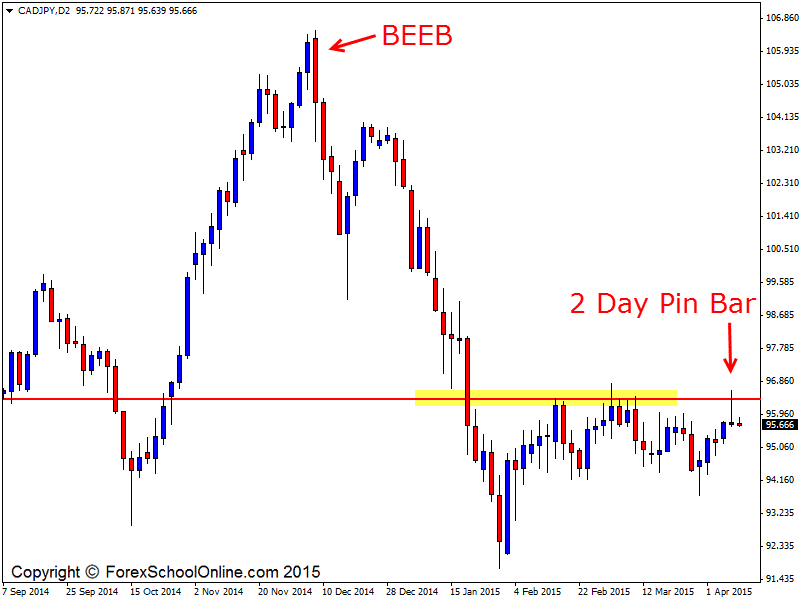
The CADJPY has fired off a Pin Bar Reversal on the 2 day price action chart inside a tight range. Price in recent times has been stuck in a tight range and unable to move either higher or lower of the strong support/resistance levels that has contained price.
This pin bar reversal is sticking up and through the recent strong resistance level and is making a false break. If this pin bar is to make any move lower and back through the sideways traffic, price would have to first confirm the pin bar and then try and make it’s way through the trouble areas.
This 2 day pin bar is a strong bearish two bar reversal on the daily chart, that when combined together make the bearish pin bar reversal. To combine the two candles I used the MT4 Time Frame Changing Indicator.
If price can make a break lower, the first short-term minor support could come in around the 95.2535 area. The major lows of the range are then around the 94.2725 area. If price moves back higher of the pin bar and can close above the 2 day resistance level, the resistance could flip and look to become a new support level and it could then become a crucial level for traders to watch for new long setups.
CADJPY 2 Day Chart


Leave a Reply