CADJPY Daily Chart
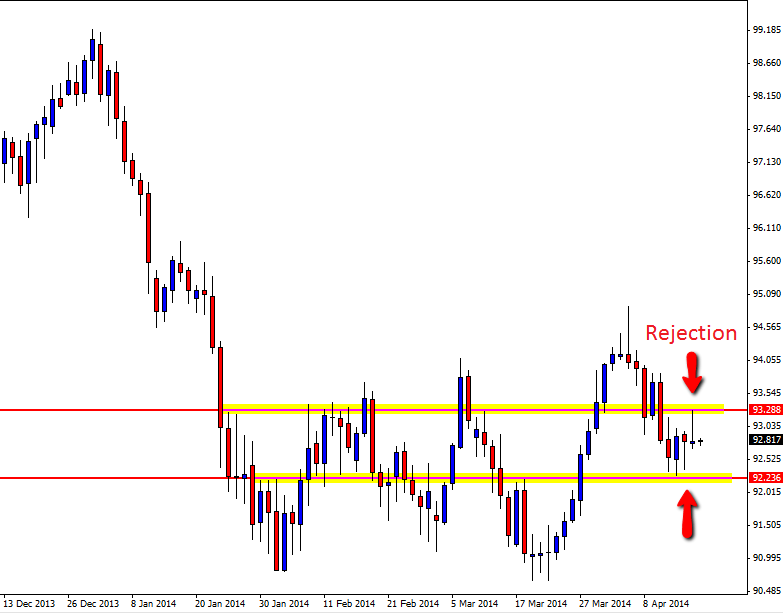
The CADJPY has fired off dueling rejection candles with price showing rejection in the last two daily sessions from both higher and lower prices. As the daily chart shows below; the most recent daily session has produced a bearish pin bar that is rejecting the overhead resistance, but the candle most previous to that was rejecting the support level below.
This dueling price action is common in a ranging and sideways trading market and that’s what the CADJPY is currently trading in at the present time. After making a huge leg lower, price has moved into consolidation and a large sideways trading period and in these markets price will often whip from one place to the other just like this recent move from the support and then rejection of the resistance. From here price may fall lower from the pin bar if the pin bar can be confirmed.
The first support area comes in around the support that price bounced of only two days ago. The best play could be to wait for a really key price action signal at either the range high or range low that is sticking out and away from all other price and that is obvious. A big mistake traders make is getting caught out making trades in sideways markets where the setup is in the middle of all the sideways action. The best trades are formed from the highs and lows.
CADJPY Daily Chart

GBPUSD 4hr Chart
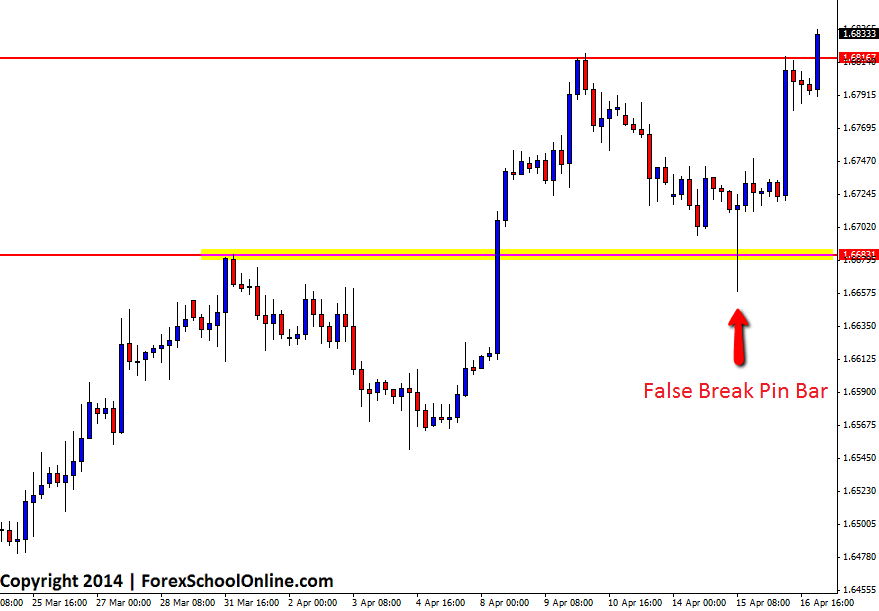
Price has soared higher and made a huge and aggressive move higher on the back of a false break pin bar on the 4hr GBPUSD chart. This pin bar was making a clear false break of the close swing point and near term support level that had been formed. The pin bar was huge compared to all the other candles, it stuck out away from all other price and was rejecting a clear level. The one worry for traders taking this trade was that there was a little traffic overhead, however as so often happens with the powerful false breaks, once price snapped back the other way, price gained momentum and moved quickly to the major resistance level. See chart below;
GBPUSD 4hr Chart


Leave a Reply