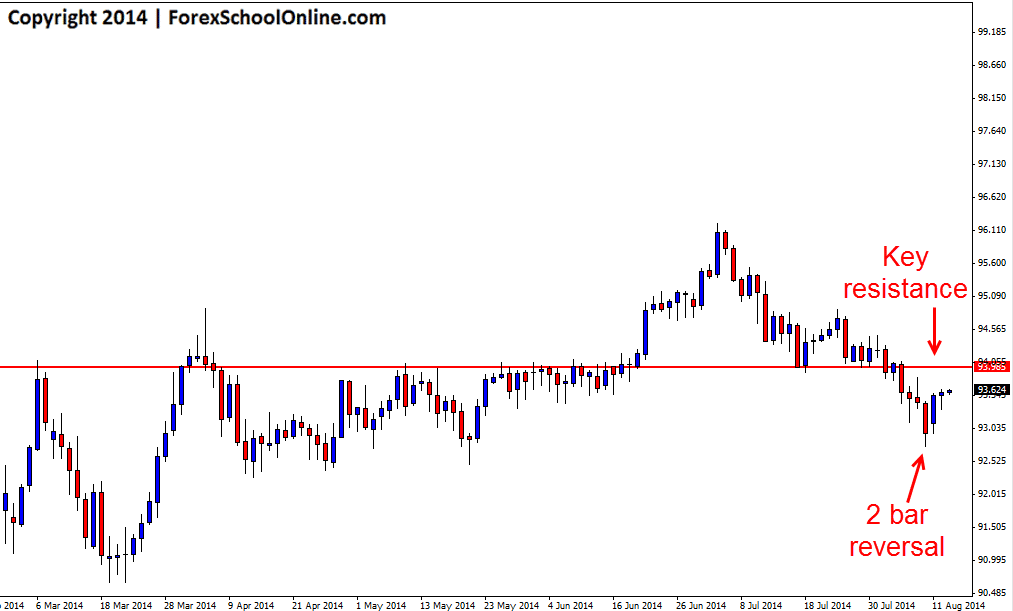
The CADJPY has fired off a 2 bar reversal on the daily price action chart. If price breaks and confirms this 2 bar reversal it would not surprise to see price gain momentum and move higher back into the recent daily key level around the Round Number (RN) of 94.00. This round number has been a critical level in this market of late with price stalling and flipping at it in recent times as the daily chart below clearly shows.
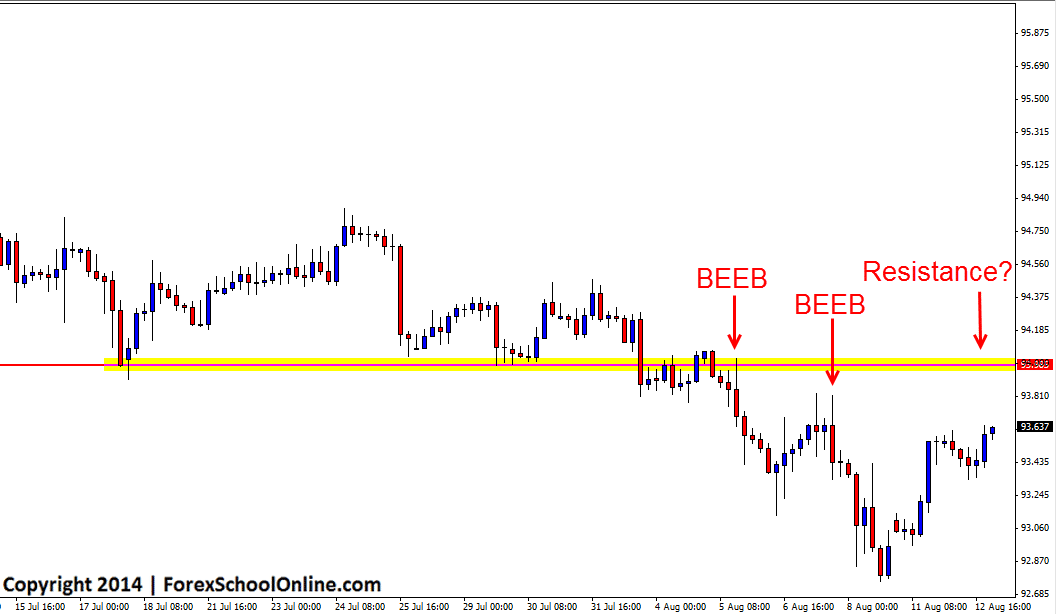
If this 2 bar reversal does send price higher and back into the old support area, the level could then look to act as a price flip level and new resistance level. This new daily resistance level could be a good resistance for price action traders to hunt short trades on their daily and intraday charts such as their 8hr, 4hr or even smaller time frame charts.
When price moves back into these key levels on the daily chart, traders have to look for key price action trigger signals to confirm any potential price action entries. Traders also need to remember that high probability price action trades are built on having a very good price action story and not just a trigger signal or one candle “setup”. The trigger signals are used as confirmation after the high probability price action story has been found, but never just on their own.
CADJPY Daily Chart

CADJPY 4hr Chart


Leave a Reply