Price action on the CADCHF has moved back higher over the last couple of sessions and into a major level that could now present as crucial for bearish traders to keep a real watch out for.
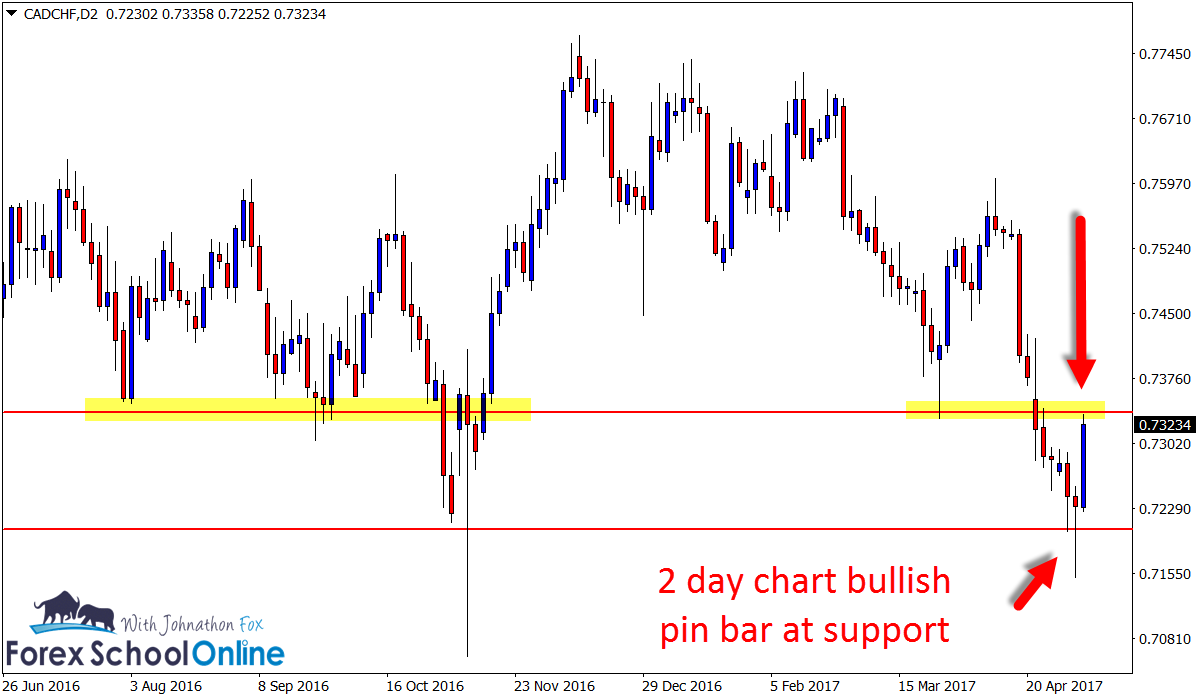
You will see the first 2 day chart I have attached below for you that price is fairly sideways and moving without a clear trend.
Price fired off a very solid bullish pin bar reversal down at the support area and this pin bar was the start of the most recent move higher.
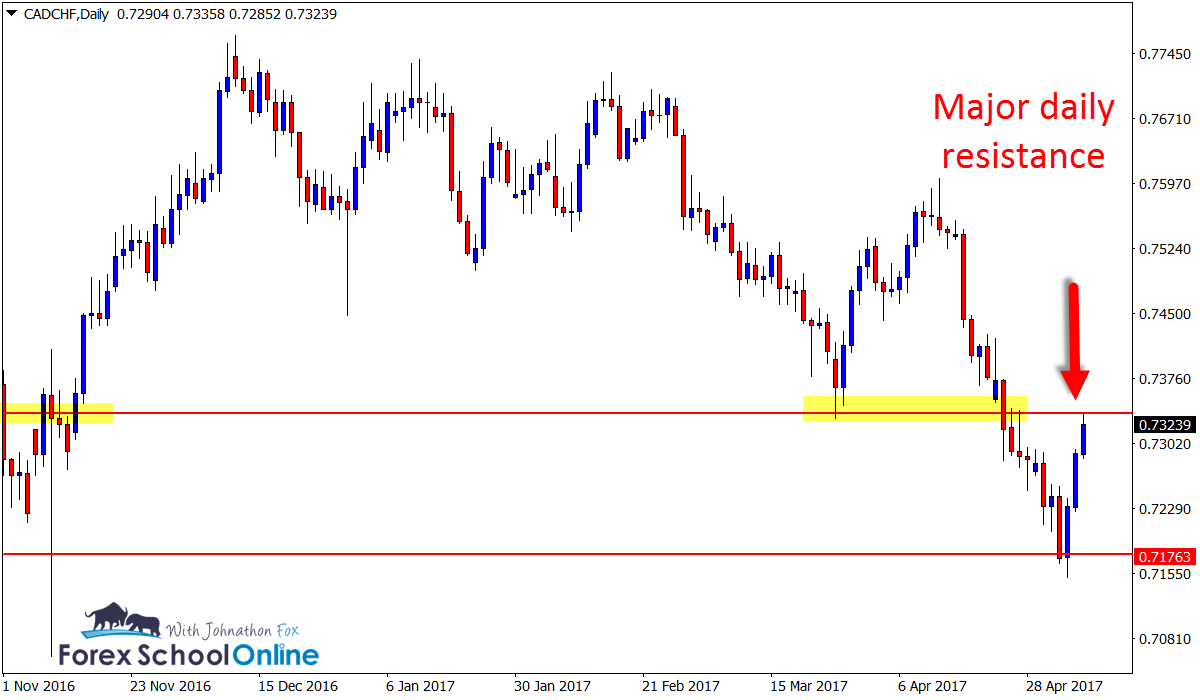
After price started this retrace higher you can see on the daily chart that price has made a strong move straight higher. As a side note; you will also see looking at the daily chart exactly how the 2 day pin bar was created with the 2 candles down at the low on the daily chart, formed together on the 2 day chart to form one candle.
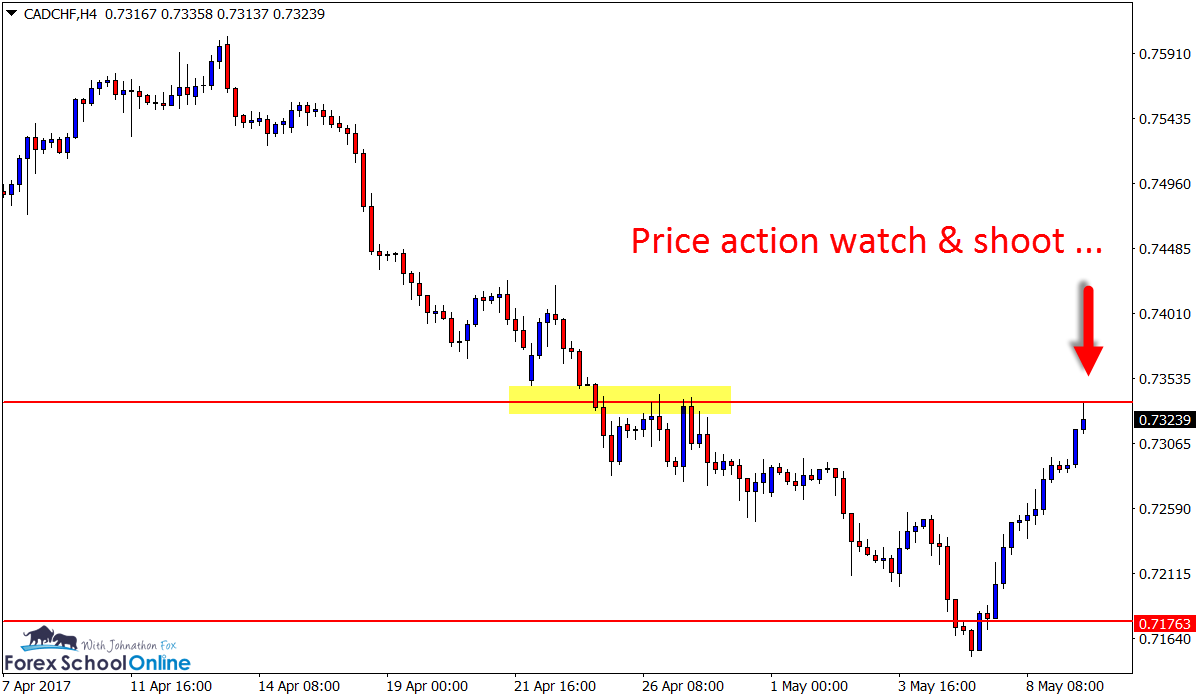
If we move to the intraday chart and the 4 hour chart in particular we can look for potential short trades. Looking for short trades on the smaller time frames will mean we are trading at a major daily level and because we are now making an intraday trade we are trading with this short term trend and momentum.
If you look at the 4 hour chart you will see there is a strong move in place lower and we would be trading inline with that. We can also look for triggers on the 8 hour and 12 hour charts. If you are unsure how to do this I have been discussing how to do this a little bit of late so just check out the lesson at Change my MT4 Time Frames to Anything I Want to.
If price breaks higher and closes above on the daily chart, then it is moving into a whole heap of chop and not much space. Like we always do, we would need to watch the close and re-mark our daily levels if that was to happen.
2 Day CADCHF Chart

Daily CADCHF Chart

4 Hour CADCHF Chart

Related Lessons:
How to Read & Take Advantage of Market Reversals When They Happen!


Amazing Trade Setup.
I like it very much