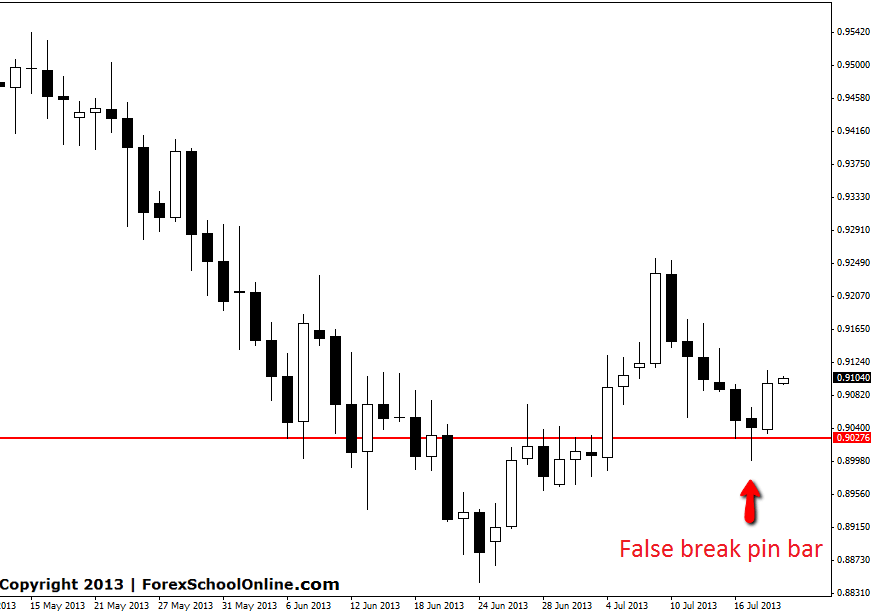
CADCHF Daily False Break Pin Bar
Price on the CADCHF has rocketed higher after producing a false break pin bar on the daily price action chart. False breaks can be super high probability plays when they are played from the correct spots on the charts. This market has been ranging over the past few months with no clear trend. The recent moment has been lower with quite a few large legs of price moving lower.
This Pin Bar was formed at the bottom of this market, which is the best place to enter ranging markets. Traders are often caught out entering ranging markets in the middle. This is often where price is at it’s most choppy and can whipsaw wildly. This Pin Bar was also formed at a proven key support area which has proved a key area for bulls to enter the market.
CADCHF DAILY CHART | 19 JULY 2013

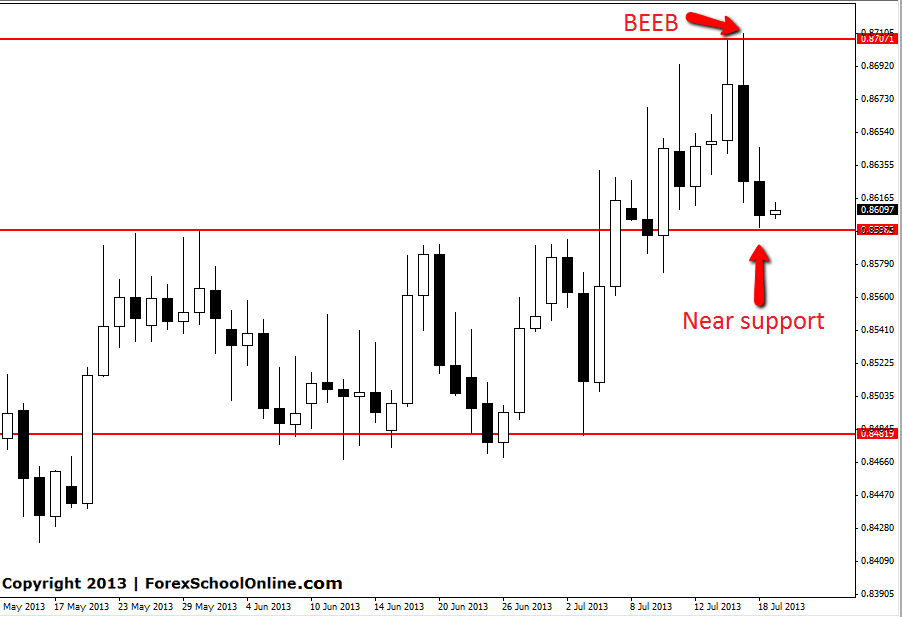
EURGBP Daily Recap
In yesterdays price action summary we discussed the bearish engulfing bar on the daily chart. To see that original post see HERE. Price has now moved into the first very close support area we highlighted in that post. From here there is a lot of chop and traffic for price to fight it’s way through. The best play for price action traders in this market may be to mark up their key support and resistance levels and then wait for price to reach them before then looking to enter any possible trades.
EURGBP DAILY CHART | 19 JULY 2013


Leave a Reply