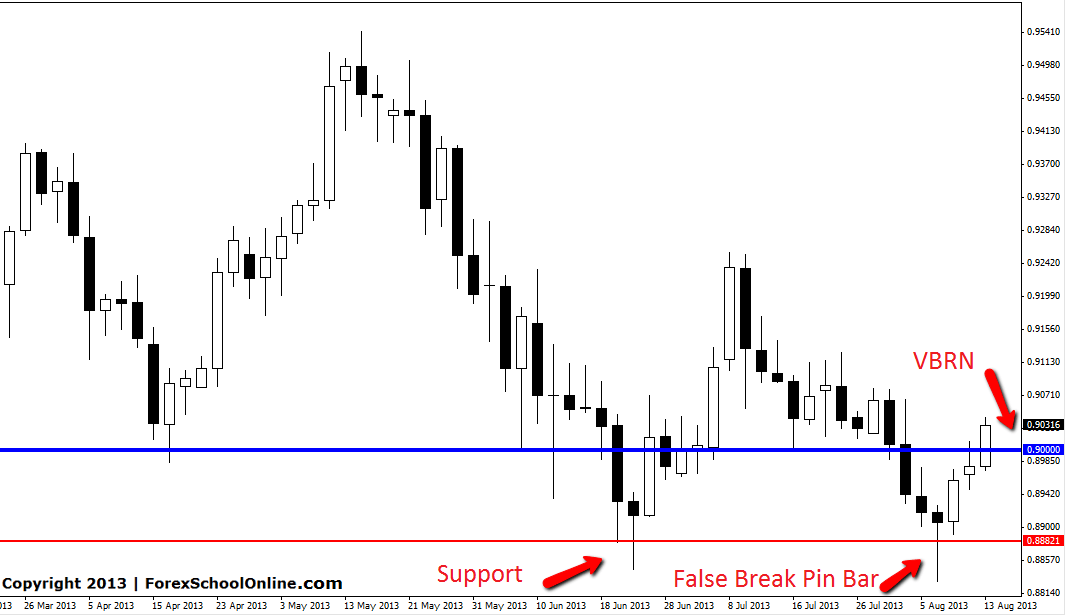
The CADCHF has moved higher after producing a large false break Pin Bar on the 2 day price action chart. This Pin Bar was formed against the very short term momentum and in a ranging market, but it was formed at a key low support area and making a false break of the key support area and double low.
This setup was discussed in live time before forming by myself and other members in the Members Live Price Action Setups Forum. Once price managed to break the high of the Pin Bar, it moved higher into the near term high and then even higher to move into the Very Big Round Number (VBRN) on this pair of 0.9000.
As I write this blog post price is trying to break out of the VBRN and move to the next resistance. The next resistance comes in around 0.9055. This chart of the CADCHF is a 2 day chart using the MT4. If you want to know how to change your MT4 charts to make any time frame you wish you should read the following tutorial here: Change your MT4 charts to make any timeframe you wish.
CADCHF 2 DAY CHART | 14TH AUGUST 2013


Leave a Reply