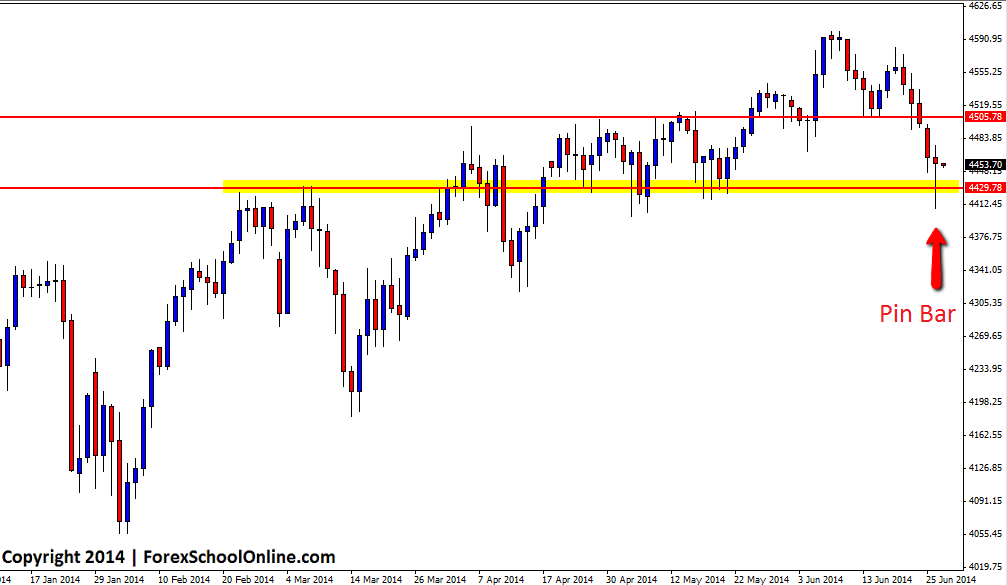
The daily price action chart of the CAC40 (France 40 Index) has fired off a pin bar. The traders who follow this blog regularly will know that we are often posting daily chart Forex price action trading strategies and a major reason for this is because that trading on the daily chart offers traders a great time frame to make high probability trades. Once traders become profitable on the daily charts they can then work their way down to the smaller time frames, but learning to become profitable on the daily charts gives traders a good base and teaches discipline.
The pin bar as shown on the daily chart below is sticking out and away from all other price and is rejecting a daily key support level. If price can break above the pin bar high and confirm the pin bar, then there is a near term resistance level close overhead that comes in around 4505.7750. If price can then continue through this level, price may be able to push onto the recent highs. If price cannot push higher above the pin, then the major daily support level that is shown on the daily chart below that the pin bar is rejecting will be the first support in the way and this could be a crucial level if price looks to move lower.
Traders looking to find the correct New York close 5 day charts that offer the CAC 40 and also a range of other markets to trade such as the major stock indices & commodities on top of their Forex pairs, can check out my latest article on Recommended Forex Broker & Charts for Price Action Traders as both brokers recommended in that article for traders both inside and outside the US offer a wide variety of markets to trade including the CAC 40.
CAC 40 Daily Chart

Related Forex Trading Articles & Videos
– Why Professional Traders Think in Uncertainty & You Should Too


Leave a Reply