NZDUSD Market Analysis – Bulls’ and Bears’ Tussle Results to Ranging Market
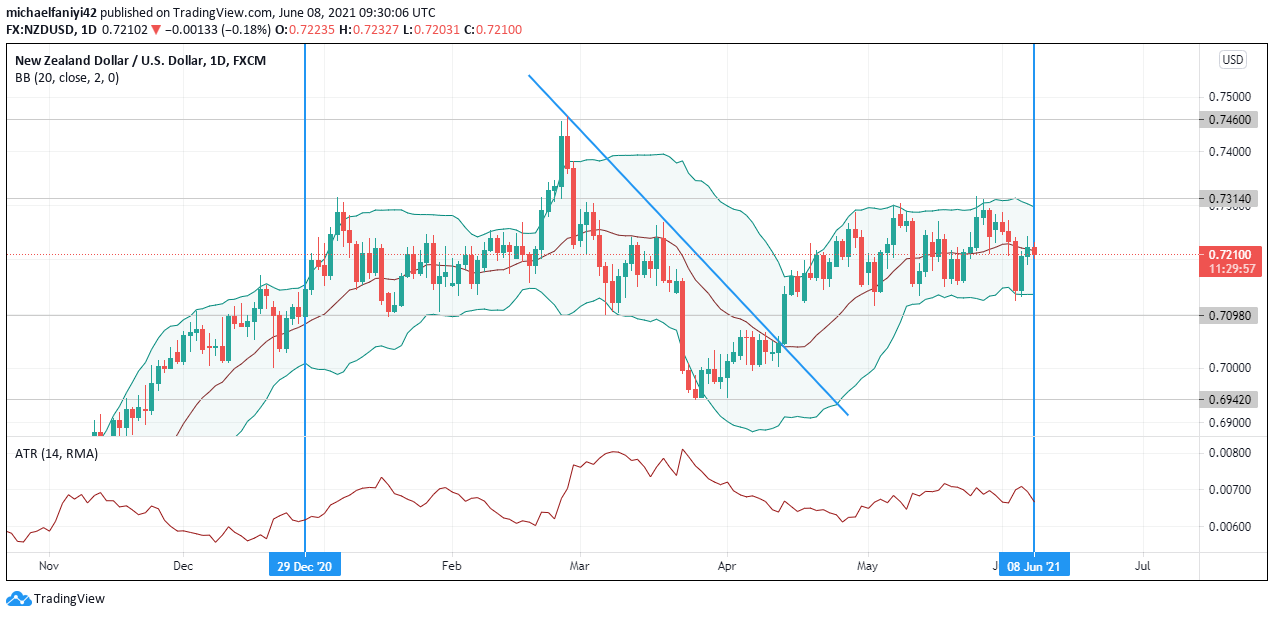
NZDUSD Bulls and Bears have canceled out each other to leave the market in a range. The 0.70980 support has been very influential in keeping the price in a range and likewise the 0.73140 resistance. Price shot up from a lower level and became stable on the 0.70980 support on the 29th of December 2020. Afterward, there has been a real tussle between the bulls and the bears, this can be seen in an almost consistent alternation of bullish and bearish candles with long wicks.
On the 18th of February 2021, the bulls rallied together and broke out of consolidation, past 0.73140, and moved up to 0.74600 resistance. There was instant rejection at the level as a similar big bearish candle with a long wick is seen. The bears brought the market back down to earth with similar strength. NZDUSD first fell back to 0.70980, then it subsequently fell to 0.69420, however, in the space of 2 weeks, the bulls raised the market back to the previous range level between 0.70980 and 0.73140 key levels.
NZDUSD Significant Zones
Demand Zones: 0.74600, 0.73140
Supply Zones: 0.70980, 0.69420
 What Next For NZDUSD Bulls and Bears?
The ATR (Average True Range) indicator shows that market volatility had been fairly even, undulating between the 0.00735 and 0.00605 key levels before the upward and downward surge. After the surge, the volatility has now returned to its previous range between 0.00735 and 0.00605.
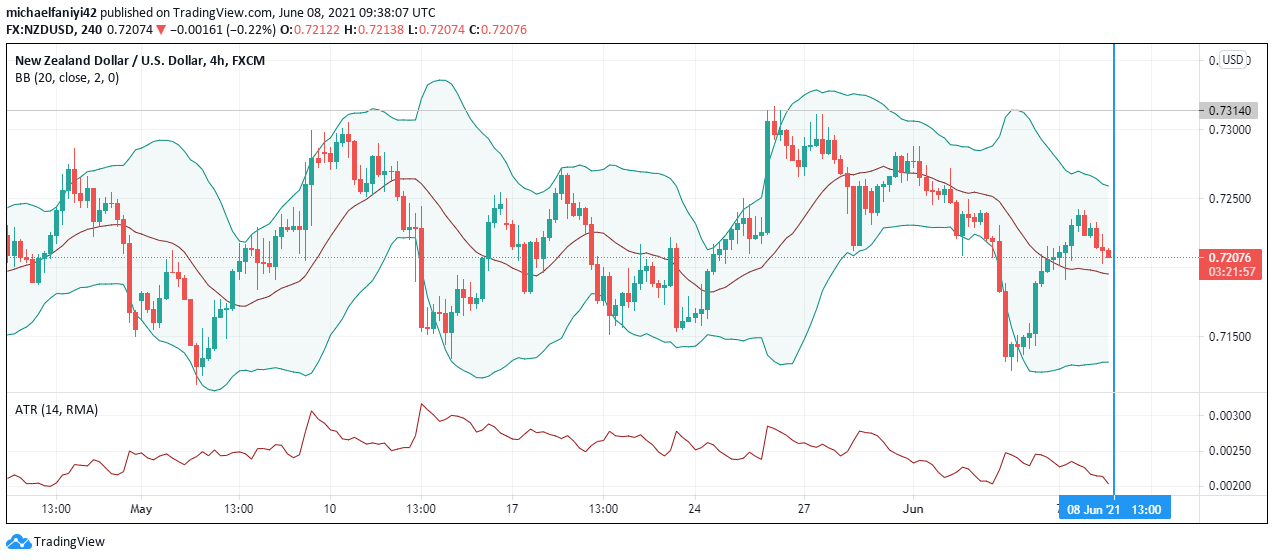
The Bollinger Band helps to see the consistency in the market movement. Except during the up and down surge, the Bands have been conveniently wedged between the 0.70980 and the 0.73140 key levels. The middle line helps to act as support/resistance to propel the price up or knock the price down along the range. Traders can buy upwards or sell downwards to the Band borders from the middle line. On the 4-hour chart, the market is seen to be moving in a zigzag movement. The market is currently bearish as three consecutive bearish candles are seen. A 4-hour look at the ATR indicator shows that there is an alternation of high and low volatility. The volatility is currently low as the market goes bearish. The candles are approaching the middle line of the Bollinger Band. The price might bounce upwards from it or break through it downward.
Note: Forexschoolonline.com is not a financial advisor. Do your research before investing your funds in any financial asset or presented product or event. We are not responsible for your investing results.


Leave a Reply