Where is the GBP/USD Price trending next?
After a long line of featuring of serial upward movements in the valuation of GBP/USD trading pair-fiat instruments, the market made reverse to later on breakout a resistance around the level of 1.3800.
GBP/USD Market
Key Levels:
Resistance levels: 1.4200, 1.4400, 1.4600
Support levels: 1.3800, 1.3600, 1.3400
GBP/USD – Daily Chart
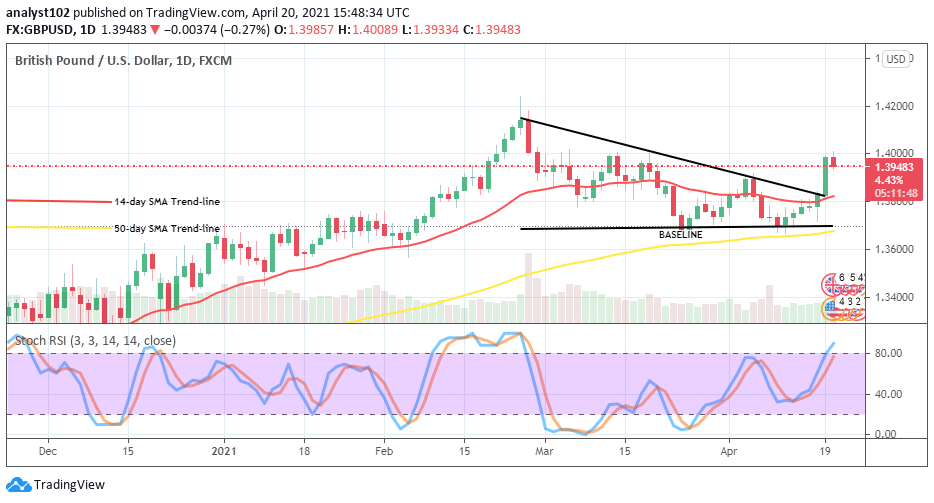
The GBP/USD gaily trading chart has shown a kind of bullish flag formation during the recently completed bullish reversal movements. As result, a bullish candlestick has formed to breakout the bearish path-way to the north. A baseline indicating support for the recent price breakout has drawn tightly a bit over the bigger SMA indicator. The 14-day SMA trend-line is located over the 50-day SMA trend-line. And, they are all underneath the current market trading zone to signify an ongoing buying spree in the currency pair. The stochastic Oscillators are making an attempt into the overbought region with their hairs slightly pointing towards the north. Where is GBP/USD Price trending next?
With the emergence of the kind of price breakout at the 1.3800 level, it is expected of the GBP/USD bulls to muster up more capacity around the buy wall of April 19 bullish candle-stick to be able to make a further upswing. However, price is currently facing resistance at the 1.4000 line. And, a breakout of it will propel the market operations towards achieving its previous and, now immediate value of 1.4200.
On the downside, the GBP/USD bears may have to push down back the currency pair’s value by timely coming up with pressure as a resistance trading situation is spotted around the 1.4000 level. If that assumption does not play out accordingly, then, it will be technically okay to allow the up-run to take a full course to a higher trading line where another chain of price rejections feature.
In summary, the GBP/USD market expected prevailing trend-pathway is still in the favor of getting to see more upsides than the downsides.
GBP/USD 4-hour Chart
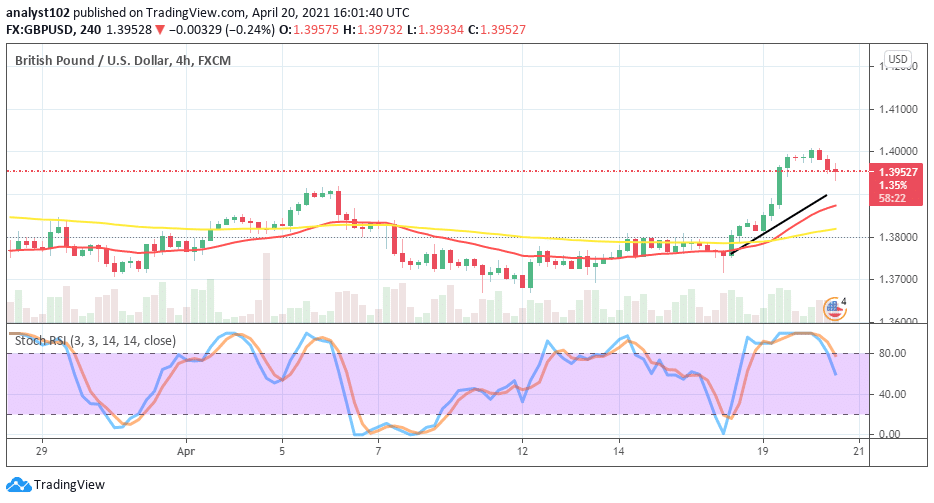
As of writing, the medium-term chart clearly shows a formation of candlesticks representing rejection signs around the 1.4000 resistance trading zone. Price now tends to decline in a reversal moving bid towards the 1.3900 level. The 50-day SMA indicator has been intercepted by the 14-day SMA trend-line from the underneath to point to the north. The Stochastic Oscillators have swerved from the overbought region to point towards the south a bit down range 80. That signifies an extent of ongoing declining pressure in the market.
Note: Forexschoolonline.com is not a financial advisor. Do your research before investing your funds in any financial asset or presented product or event. We are not responsible for your investing results.
Learn to Trade Forex Online
British Pound Price Prediction: GBP/USD Breaks out the Bearish correctional Line Around 1.3800 Point
Footer

ForexSchoolOnline.com helps individual traders learn how to trade the Forex market
WARNING: The content on this site should not be considered investment advice and we are not authorised to provide investment advice. Nothing on this website is an endorsement or recommendation of a particular trading strategy or investment decision. The information on this website is general in nature so you must consider the information in light of your objectives, financial situation and needs.
Investing is speculative. When investing your capital is at risk. This site is not intended for use in jurisdictions in which the trading or investments described are prohibited and should only be used by such persons and in such ways as are legally permitted. Your investment may not qualify for investor protection in your country or state of residence, so please conduct your own due diligence or obtain advice where necessary. This website is free for you to use but we may receive a commission from the companies we feature on this site.
We Introduce people to the world of currency trading. and provide educational content to help them learn how to become profitable traders. we're also a community of traders that support each other on our daily trading journey
Forexschoolonline.com is not a financial advisor. Do your research before investing your funds in any financial asset or presented product or event. We are not responsible for your investing results.

Leave a Reply