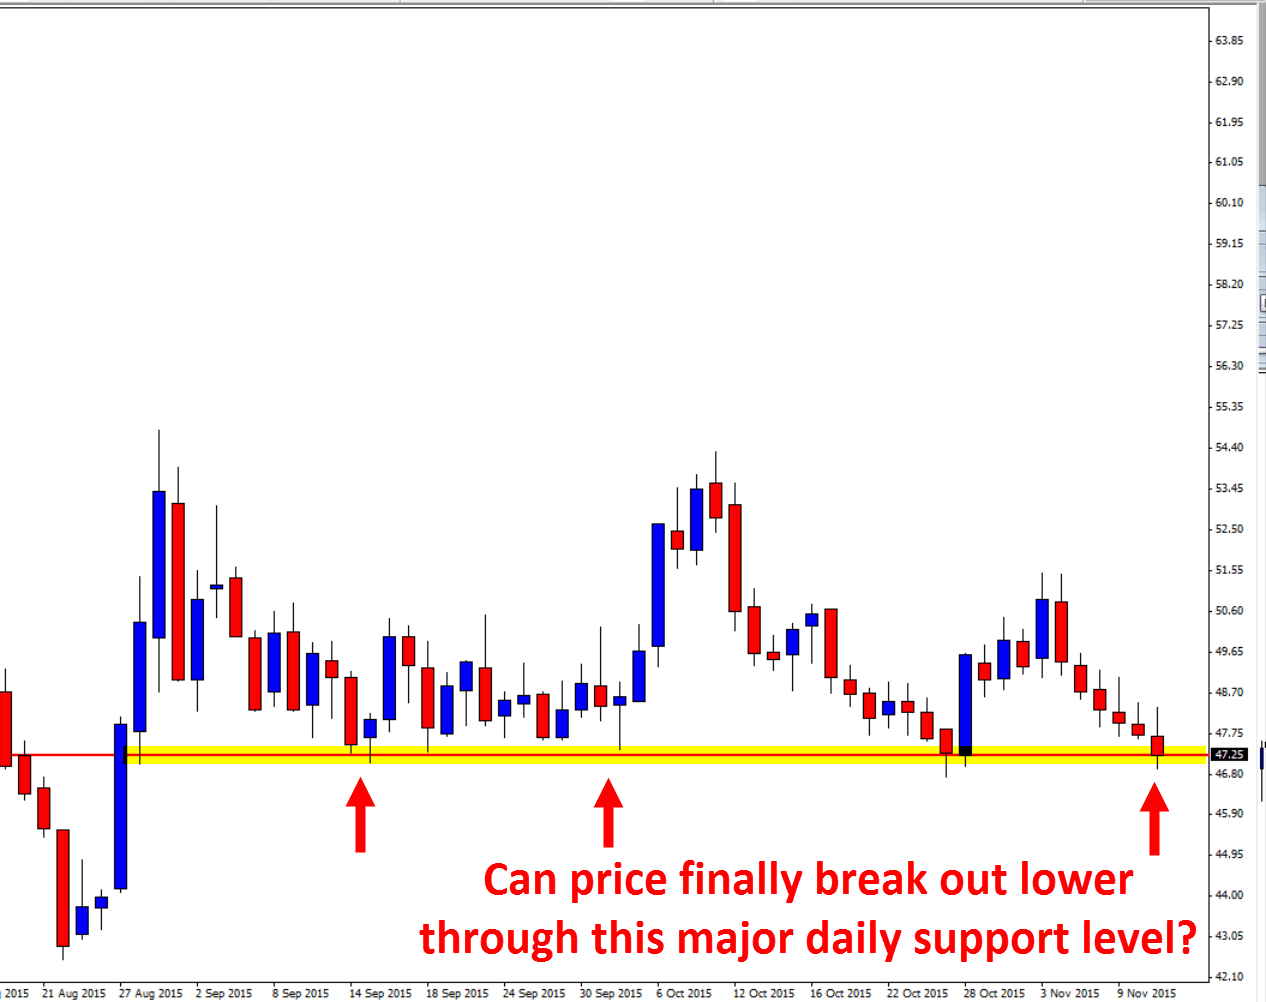
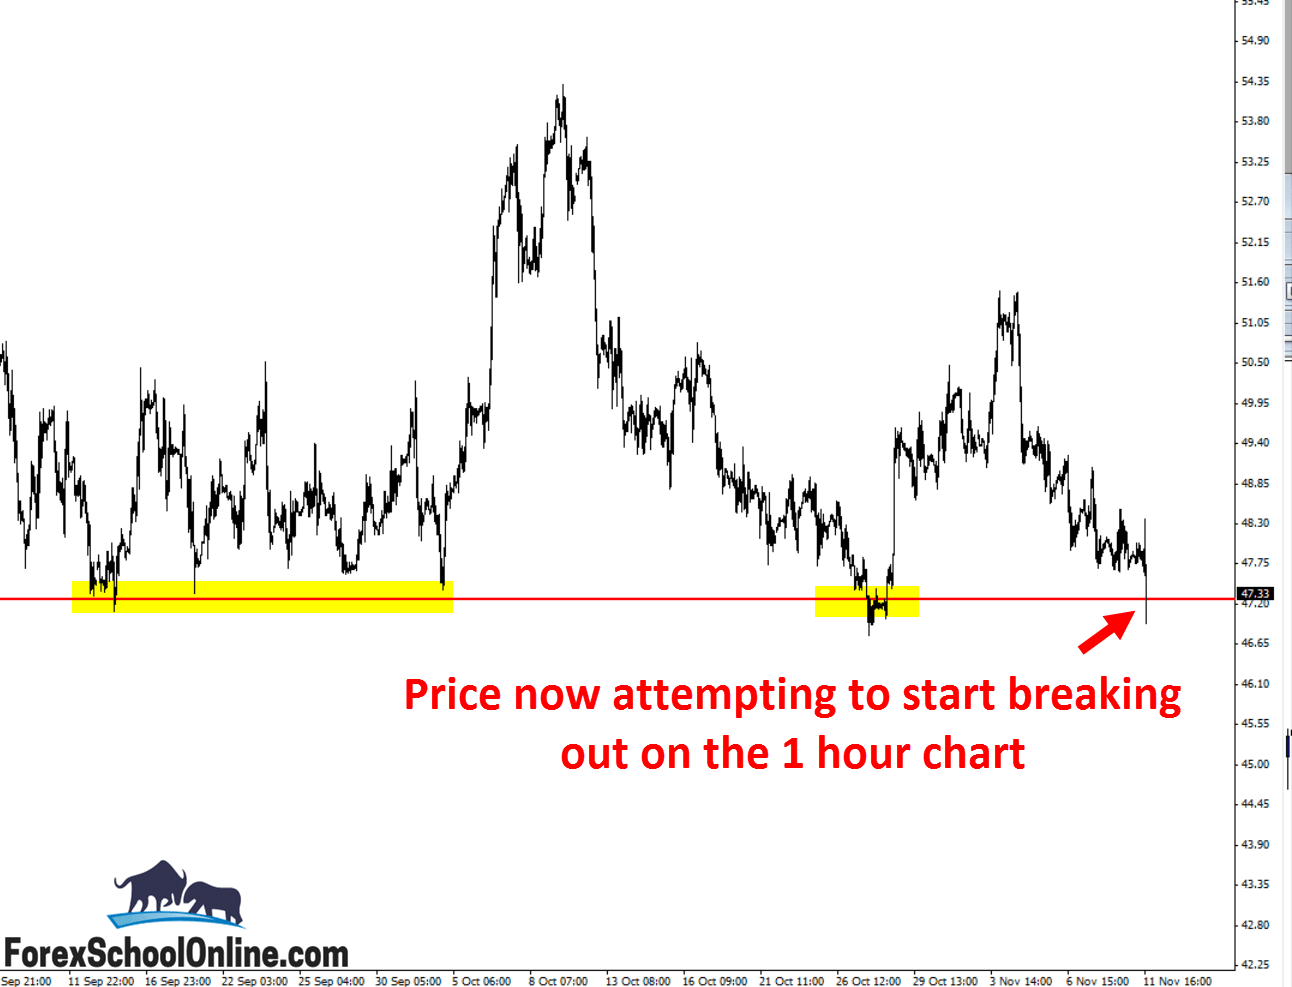
Price in the Brent Oil vs. USD market is now trying to break lower and through the major price flip support level on the daily price action chart. As I write this market summary, price on the intraday charts, such as the one hour chart below, is attempting to breakout lower.
As the daily chart shows below, the level that price is attempting to break is a major daily support level that, especially in the last twelve months, has been crucial in this market for where price has gone. This level has acted as a barrier for price moving lower, and every attempt at making a serious move lower has been blocked repeatedly.
Price has made at least five previous failed attempts, leading up to where price is now. As we have often discussed in the past, the same with price winding up and going into a super tight consolidation, the longer price takes to break a level and the more attempts it has at breaking out of the one level, then normally, when eventually it does breakout of that level, the breakout will be extra explosive.
This is the same reasoning behind why price explodes after it has been winding up tighter and tighter into a really tight consolidation. We have the same process occurring. Price is eventually breaking out and it is doing so with a massive amount of order flow that all of a sudden comes into the market that was not there beforehand.
We need to watch this one closely to see if price can breakout. If it can breakout, it could provide for some really explosive trading opportunities. Advanced and aggressive traders could look to trade breakout setups ensuring that they use the whole price action story as their guide. Make sure you are using things like candlestick information and looking to see where the candles close like I discuss in the lesson The Secrets Traders Can Learn From Candlesticks & Price Action
For other traders that want more confirmation, you could look for the high probability “Breakout & Re-test” trade setup. This is a super high probability trade setup where you are trading with the strong momentum, and also, at a major level. Read about this inside the lesson First test of Support & Resistance Trading Strategy.
Daily Chart – Daily Support Level

1 Hour Chart – Breakout?


Leave a Reply