Beginner’s Guide to MetaTrader 4 (MT4)
Introduction
The most popular Forex Trading Platform in the world is MetaTrader 4 (MT4). This is a platform through which anyone can do Forex Trading or analyzing the financial market. This software was developed by MetaQuotes. This lesson will let you know about the basics of how to use the MetaTrader 4 (MT4) trading platform.
How to Install the MT4 Platform
To download the MetaTrader 4 platform, you can go straight to the article where we discuss the recommended brokers for price action traders and download a Free Demo platform. You can do that here:
Download FREE New York Close MT4 Charts

A setup file  (mt4setup) will be downloaded into your PC. Click on the mt4setup file to initiate the installation. You have to agree with their terms of this license agreement and then click next, as shown in the following figure:

When the installation is successfully completed, click the finish button to exit.

Now, click Next to open a demo account because without opening a demo account, you cannot operate this software.

Select New Demo Account from the drop down menu, and then click next.

After clicking Next, a new popup window will appear. Fill in the blanks. Select currency, account type, leverage, and deposit. Select the radio button “I agree to subscribe to your newsletters”, and then click Next.

Now, you will get a user ID and password. Keep your user ID and password in a safe place. Click Finish to log in.

How to change the password on the MT4 platform
To change the password on the MT4 platform, click on the “Tools” located on the toolbar. Now, a popup window will appear. You can easily change your MT4 password from here.

How to Navigate the MT4 Platform
The following is a screen shot of what your MT4 platform will look like when you first open it up. MT4 opens with four different currency pair chart windows like the EURUSD, GBPUSD, USDCHF, and USDJPY charts.
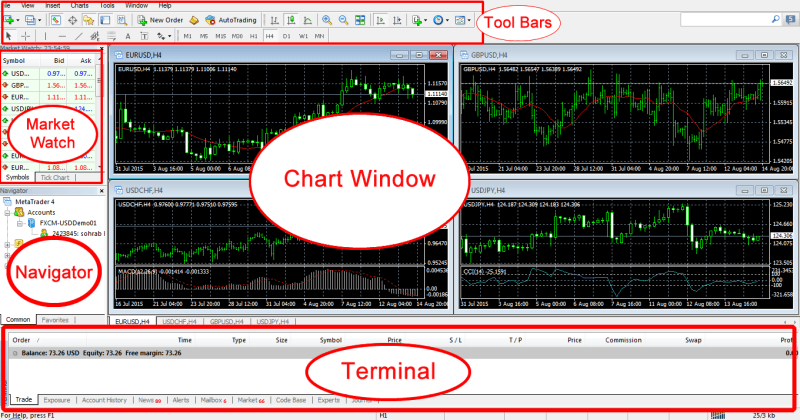
For the time being, let’s cover the primary elements of every window you find in the picture above:
- “Toolbars” is the first window located at the very top of the MT4 platform. In this window, you will find different icons to do different things. We have discussed these icons in the later part of this article.
- The next window of the MT4 platform is the “Chart” window. Here, you will see the running chart(s) you have open.
- Below the Chart window is the “Market Watch” window located at the top left corner of the MT4 platform. This window shows every pair (symbol) of the market available according to your broker, and shows you their current bid prices and asks prices. To see every symbol offered by your broker, just right click inside of the market watch window and click to “show all”. By pressing (Ctrl + m), you can easily hide / unhide the market watch window.
- The next window is the “Navigator” window. This window will show your username, indicators, expert advisors, and scripts. To hide / unhide the navigator window, press (Ctrl + n).
- At the bottom of the MT4 platform, you will see the “Terminal window” showing a few tabs within it: Trade, Exposure, Account History, News, Alerts, Mailbox, Market, Codebase, Experts, and Journal. You can click on every tab to get acquainted with what it means. But, the most important tab is the “Trade” where you can see the running and pending trades. The Account History tab shows your account activity like deposits, withdrawals, profit, or loss. You can find your full trading history from here. You can easily hide/unhide the terminal window by pressing (Ctrl + t).
How to setup your MT4 platform for clean price action trading
For a price action trading, we need to setup our MT4 platforms chart. According to your own personal style and color choices, you can customize your MT4 platforms chart. Personally, I like a white background with a black foreground. Here’s the way to setup a clean white chart for ideal price action trading:
How to open a chart
You can open a chart by three different ways:
A. Click on the File menu at the top left of the MT4, and then click “new chart”.
B. Right click on the specific currency pair you want to open in the “Market watch” segment, and then click “chart window”.
C. Just below the File menu bar, there is an icon named “new chart”. Click on that icon, and then select the specific currency pair you want to open.

How to set the properties of a chart
Open your desired chart, then right-click the chart and select properties. Now, you will see a popup window appear.

On the properties popup window, you will find a “color scheme”. By clicking on this color scheme, you can change the color of your chart. I have clicked on “Back on White” and my chart shows black and white candlesticks on a white background, as shown in the following figure:

After that, you can take off the “grid” and “volume” by right clicking the chart and un-selecting grid and volume.
There is a “common” tab located at the right side of the “colors” tab. Using this common tab, you can change certain features like volume, grid, ask line, period separators, auto scroll, etc. You can also change the chart from candlestick to the bar chart or line chart through this common tab.
How to save your chart as a template
If you want to save the chart according to your desired color scheme and other chart properties, you can easily do it by saving the chart as a template.
To do this, click on the “Template icon” located at the top right corner of the toolbar, and then save the template. There is another way to save the template. Right click on the chart, then select template, then click on “save template”.


You can change the chart type by using the “chart type icon” located in the toolbar. You can select candlestick, bar chart, or line chart – whatever you want. But, I suggest you to use candlestick chart for better understanding the Forex market. You can use the zoom-in/zoom-out icon to make the chart zoom in or out. To change the time frame of the chart from 1 minute to monthly, use the time frame icon located in the toolbar.
If you want to open a new chart with your existing template properties, you can easily do that. Open the new chart, right click on that chart, select template, then click on your previously saved template. Now, you will see your new chart having a new currency pair that will be converted to your previously saved template.

How to set up 4 different time frames of one currency pair
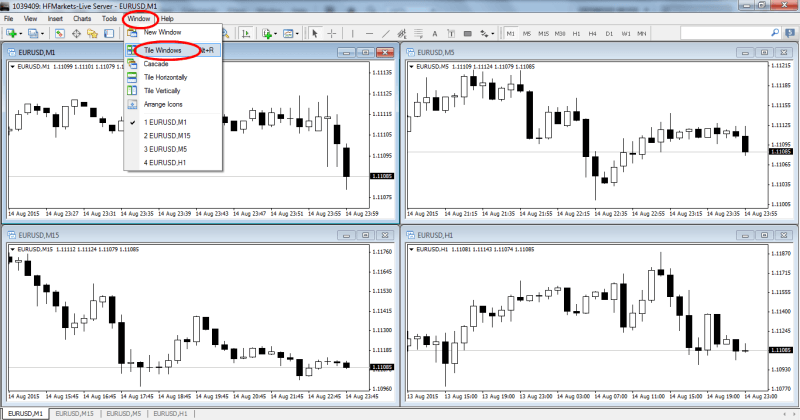
You can easily set up 4 different time frame charts of a single currency pair in the same screen. To do this, open 4 new charts having the same currency pair. Now, select each chart, and then click on the time frame icon gradually from 1 minute, 5 minutes, 15 minutes, and 1 hour. Now, click on “window”, which is located at the toolbar, and then click “Tile Windows”. You will see that MT4 will automatically set 4 different time frame charts of a single currency pair in the same screen.
How to analyze multiple markets quickly
If you want to analyze as many different chart windows as you want in the MT4 platform, you can easily do it by clicking on the tabs at the bottom of the MT4 platform showing currency pairs name. You can easily edit any chart by clicking on it, and then using the toolbars icon just like we have already discussed.

How to setup more than 4 charts in the same screen
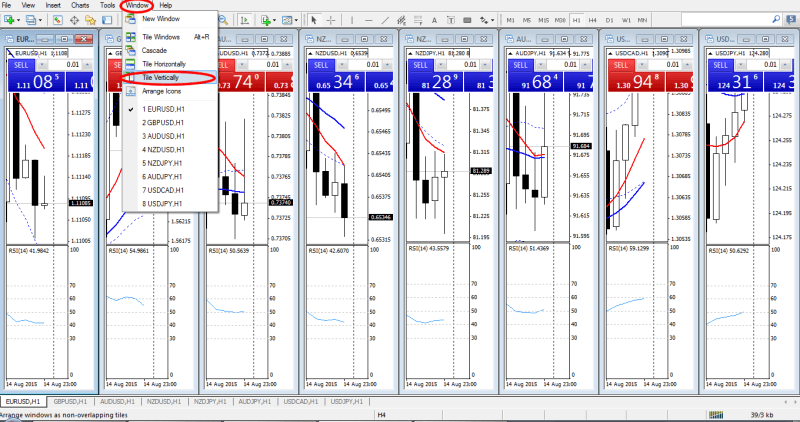
To set up more than 4 charts of the same timeframe or different timeframes in the same screen, open all those charts, then click on “Window”, then click “Tile Vertically”. Now, you will see all of your charts in the same screen, as shown in the following picture:
How to Open a Trade
You can open an entry using one of the following ways:
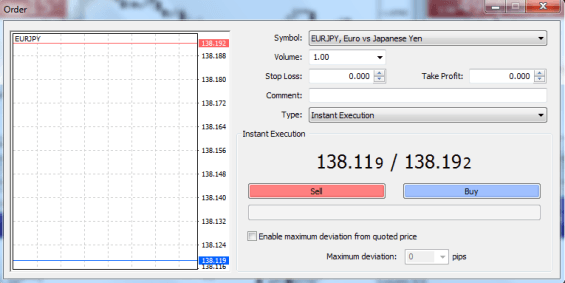
- Using Market Watch Window: Double click on the desired pair or right click on the desired pair, and then click “new order”. Then, set your desired volume and click on sell or buy. You may set Stop Loss and Take Profit at this time if you want.
- Using an Active Chart: Right click on the active chart, then click on “trading”, and then “new order”. You can simply open an entry by clicking Sell / Buy located at the top left corner of the active chart, but to do this, you must set your desired volume first by pressing the arrow key or through the keyboard.

- Using the Toolbar: You can easily open an entry by clicking “new order” located on the toolbar.

- Using F9: There is a shortcut key in your keyboard (F9). You can open an entry by pressing F9.
How to Modify a Trade
To modify a trade, open the terminal (Ctrl + t), then double click on the trade you want to modify. Now, you will find a popup window. Select “modify order” from the drop-down menu located beside “type”. Now, you can modify your “stop loss” or “take profit”, and then click on “modify” row located at the bottom of the popup window.

How to Close a Trade
Just like the modify option, open the terminal, and then double click on the trade you want to close. Now, a popup window will open. Select “market execution” from the drop-down menu located beside “type”, and then click on “close” located at the bottom of the popup window.

How to Monitor Your Running Trade
You can monitor your running trade either through the chart or through the “Trade” section of the terminal. You can easily view your terminal through a shortcut (Ctrl + t) or by clicking on “View” on the toolbar, and then selecting terminal.

How to check Your Trading History
To check your trading history, you have to open your terminal (Ctrl + t), and then click on “Account History”. Here, you will find each of your closed trades showing, trade entry time, type (buy/sell), size (trade volume), symbol (currency pair), entry price, stop loss, take profit, trade closing time, closing price, commission (not applicable for every trading account), swap (if you carry your trade from one day to another day, you have to pay a little as a swap charge), and finally, profit / loss.

Recap
I hope now you can easily set up your MetaTrader 4 platform for a clean and clear price action trading. If you have any questions at all, please just post them in the comments section below or send me an email. You may be interested in the related lessons and articles of this post because I have added some related MT4 indicators and expert advisors that you can use now that you know how to use this really popular trading platform.
Safe trading and all the success,
Johnathon




Good evening Johnathan I I’ve never traded before I could really use some help. I’m trying to trade a demo mt4 account but I’m not sure what I’m doing wrong, do you think there is someone I could call and talk to. I’m from Jamaica and nobody in my circle believe in what I’m doing just need someone to reach out to so could get a better understanding of what I am doing. Basically I just need to understand how to navigate the charts how set stop lose and things like that. I know you don’t know and may even care but I message is a S.O.S I really need help I’ve been failing too long please if you or someone you know could just reach out me. My number is 876527-0705 my name is Rohan please and thank you enjoy the rest of your day
hi jonathan. am greatful for this priceless lessons. i have 2 questions . 1 how many pip gaps should i give to place my stop loss whenever am trading? 2 what time exactly does american trade session and european trade sessions clash for most active trade ?
Hi Nnoje,
the stop loss will depend on the trade you take, the time frame, the current price action and your personal rule set.
The two sessions overlap (both open at same time) which is when the bulk of the trading is done for each 24 hour period.
Johnathon
Hi Nita,
checkout the guide here; https://www.forexschoolonline.com//how-to-stop-missing-trades-with-mt4-mt5-sms-mobile-alerts/
Johnathon
Thank you so much Jonathon – this was a great help.
Can you please explain to me how to set the alerts when price is approaching the stop loss or a price of significance,
I thought I knew everything about MT4 platform, of course I didn’t. I am not that smart. I would like to know one more thing, maybe it will be in one of your lessons. The trendline, how do I get it to not go off the charts? I can’t seen to control the length of it. That has bothered me for a long time. I am learning so much. Thank you, once again.
Hi Sandi,
I do not use trend lines and cannot give much advice on how to mark them or the advanced uses in Metatrader.
Safe trading,
Johnathon
Hi Sandi,
it is possible to make a trend line a short one.
When you draw a trend line that line will go outside of your screen. You need then press right click on that trend line and go to settings under “Trendline properties” and choose sub-tab “Parameters”.
There you will see checkbox next to word “Ray”.
Deselect that checkbox and press “Ok”. This way your trend line will become a line which you can retract or extend to desired length.
I hope this helps.
Sell and Buy which one of this means the graph is going up and which one means the graph is going down…?
Hi Daniel,
if you want to BUY this means price of the trading pair is going Up and you think it will go UP.
If you think price of trading pair will go Down then you should open SELL order so you earn money.
So
–when you open SELL order graph with price should go DOWN
–when you open BUY order, graph with price should go UP