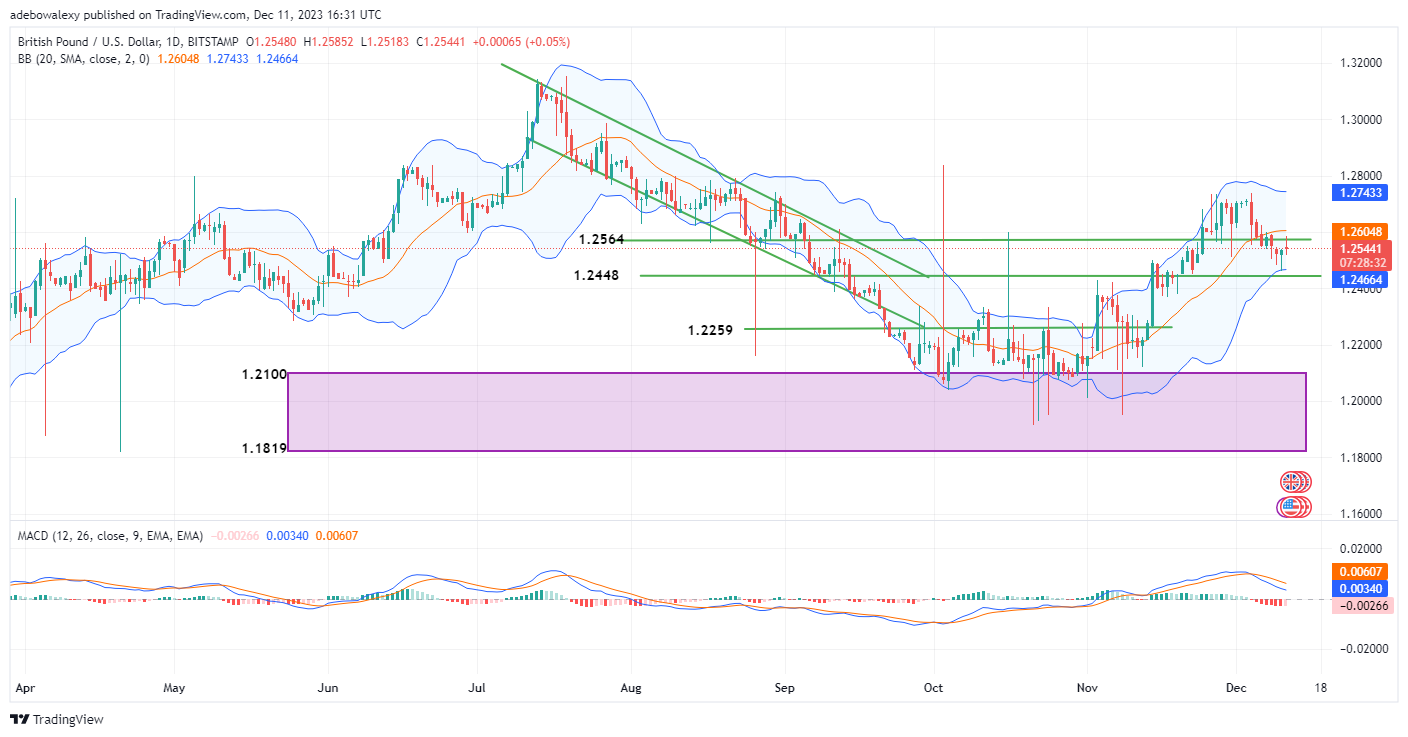
The GBPUSD market appears to be in gridlock as it awaits the emergence of key fundamentals. Nevertheless, the pair is trading at a considerable distance from the support at the 1.2448 mark. Let’s take a closer look at the market for more insight.
Key Price Levels:
Resistance Levels: 1.2544, 1.2600, and 1.2700
Support Levels: 1.2500, 1.2400, and 1.2300

GBPUSD Approaches the 1.2546 Mark
Despite a minimal downward correction in the GBPUSD daily market, the current price stays above that of the previous session. The last price candle on this chart reveals that bulls had attempted to break the resistance at the 1.2546 mark, resulting in a struggle between upward and downward forces and introducing some contraction in the pair’s price.
The Moving Average Convergence Divergence (MACD) indicator lines have fallen closer to the equilibrium level, but the last bar on the MACD suggests that downward forces are weakening, aligning with the opinion that bulls are exerting positive influences on the market.

GBPUSD Upside Forces Are Gaining Ground
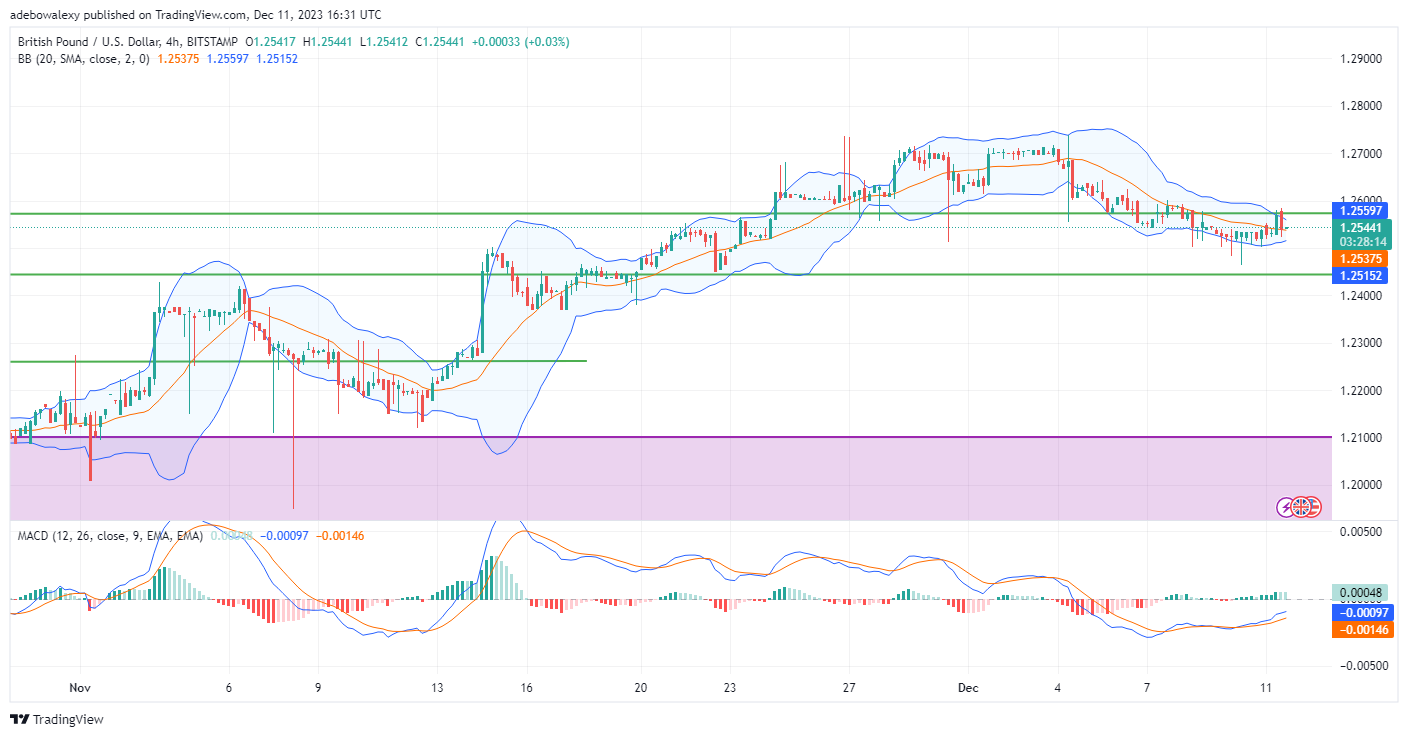
Price action in the GBPUSD 4-hour market indicates that some gainful moves may be developing. Bulls are taking a stand against downward forces, with price candles appearing just on top of the middle limit of the Bollinger Bands.
The Bollinger Bands are contracting further, and the lines of the MACD indicator continue to rise slightly upwards, while pale bars are now appearing above the equilibrium level. Technically, it could be suggested that price movements may experience a significant bounce towards the 1.2650 mark.
Do you want to take your trading to the next level? Join the best platform for that here.


Leave a Reply