Whilst there are many, many bearish candlestick patterns, some are easier to find and trade than others.
In this post we look at some of the most popular bearish candlesticks patterns.
These are also the candlesticks you will be able to find all over your charts. They can be found on all time frames and you can trade them in many different markets.
Bearish Pin Bar Reversal
The pin bar reversal is one of the most popular candlestick patterns in the markets today.
You can find the pin bar on all of your charts and it is very simple to trade.
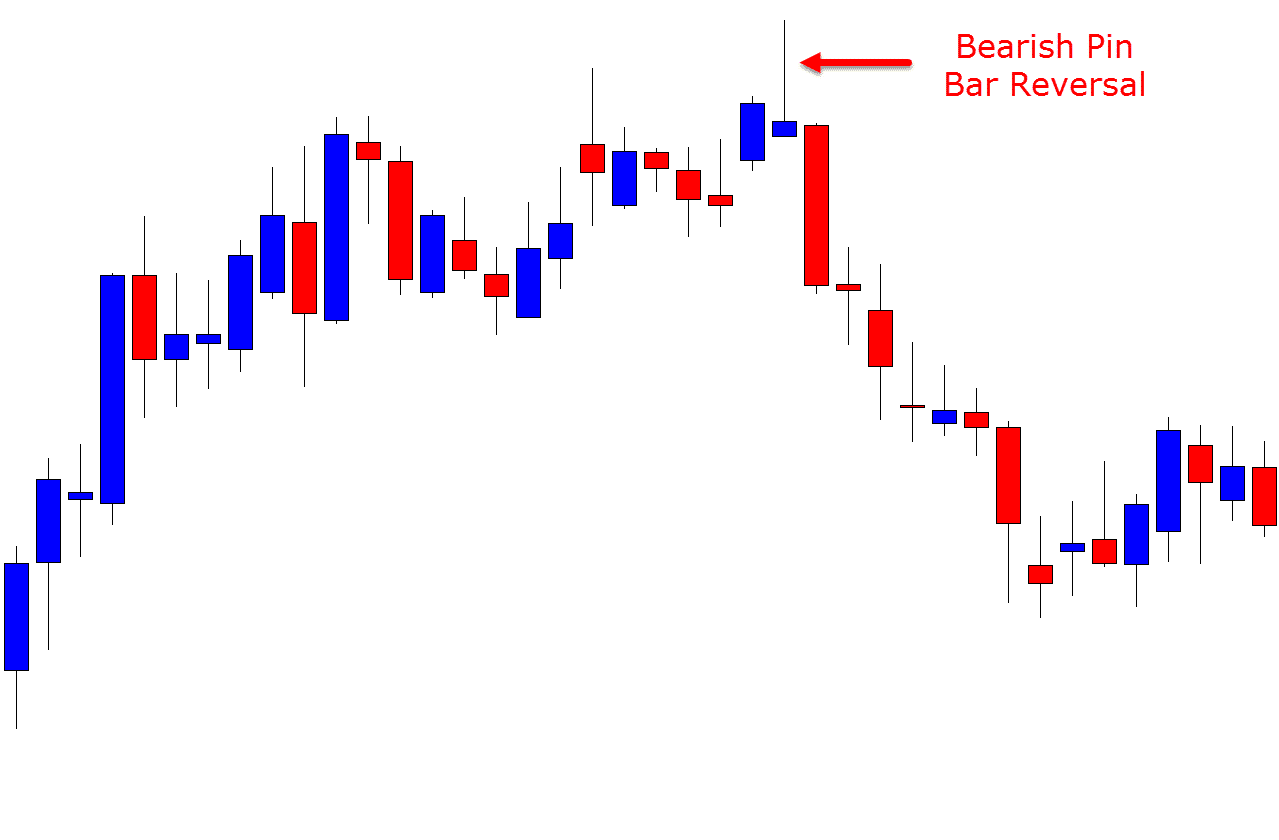
Whilst the pin bar can be both a bullish and bearish signal depending on which way it forms, for a bearish pin bar we need to see a few things.
Price must be moving higher before the bearish pin bar forms.
The pin bar must then move higher before snapping back lower in the same session.
Below is an example of a bearish pin bar reversal. Price is in a move higher before the pin bar is formed and this leads into a reversal back lower.

Bearish Engulfing Bar Candlestick Pattern
The engulfing bar is one of the more reliable candlestick patterns when traded under the correct conditions.
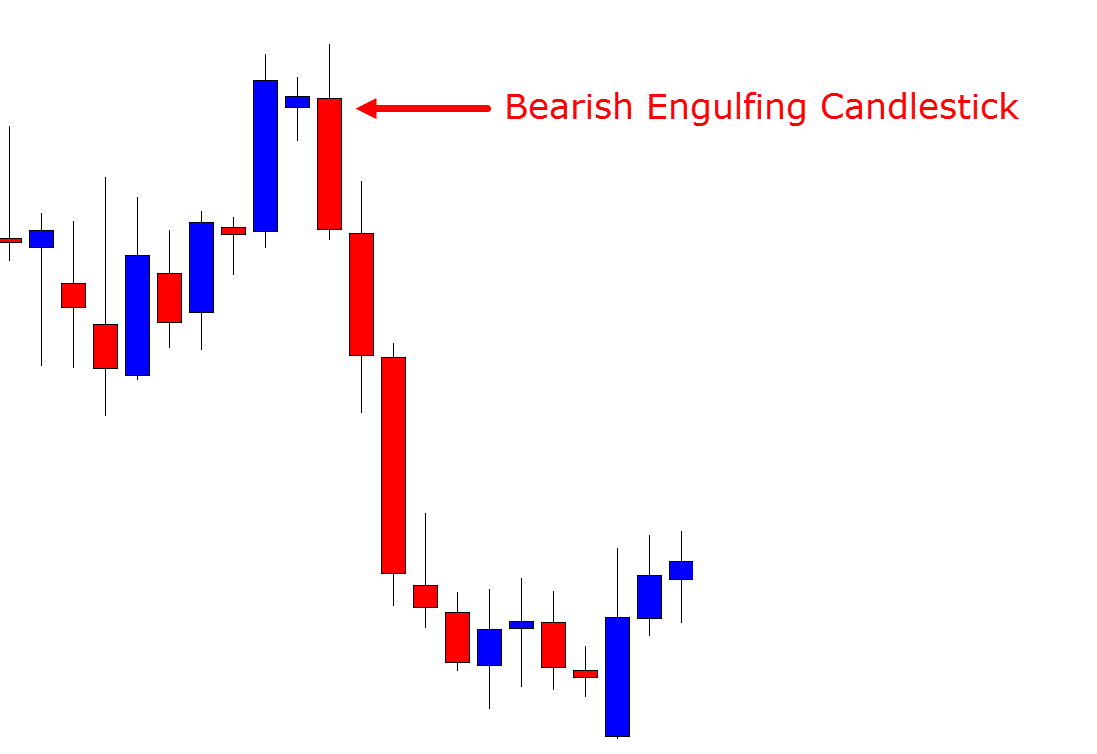
For the bearish engulfing bar to form price needs to fully engulf the previous candle. This shows that the momentum has completely shifted.
The example below shows a bearish engulfing bar.

Price moves higher above the high of the previous candle before snapping lower below the low of the previous candle to fully engulf it.
Bearish 2 Bar Reversal
The bearish 2 bar reversal is very similar to the bearish pin bar.
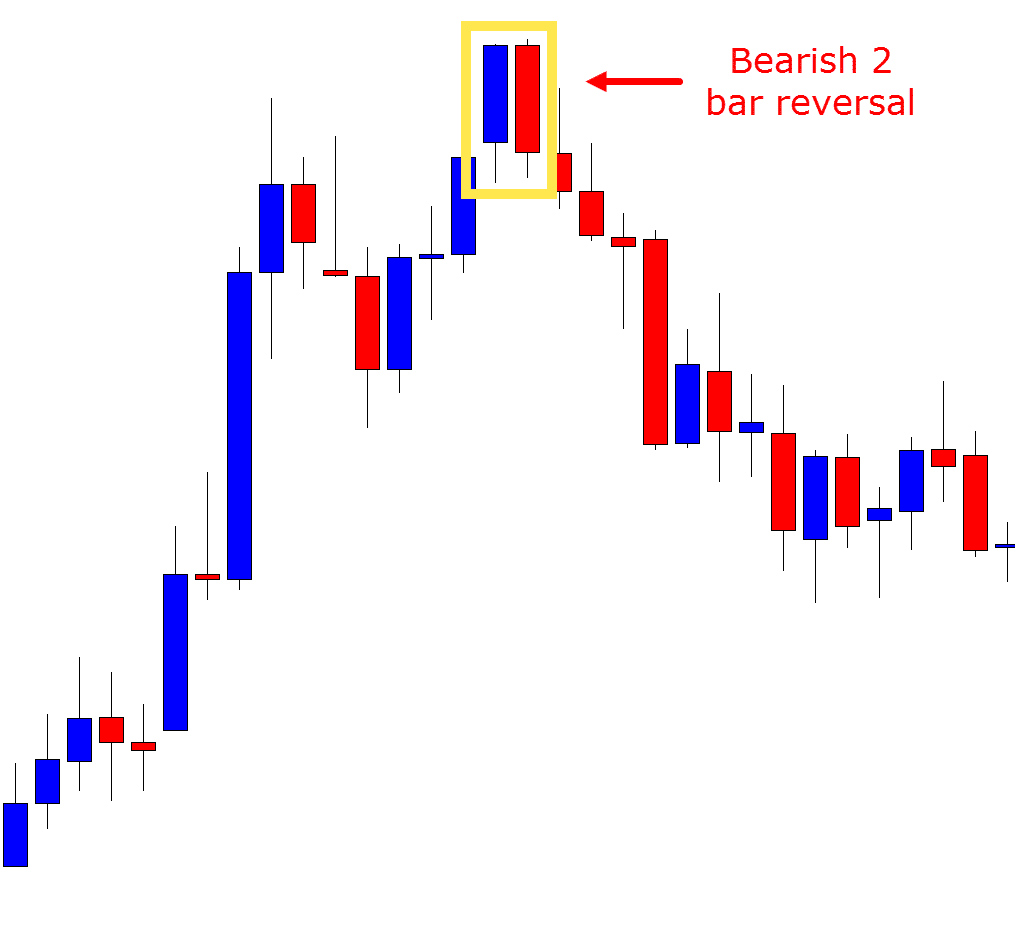
The main difference between the two different candlestick patterns is that where the pin bar forms in one session, the 2 bar reversal forms over two sessions.
In the first session price makes a move out higher. In the second session price snaps back lower.
The example below shows a bearish 2 bar reversal up at swing high.

Price makes the first candle higher before snapping back lower and completing the 2 bearish 2 bar reversal.
Bearish Hanging Man Candlestick Pattern
The hanging man candlestick pattern shows a potential reversal lower could be about to play out.
The hanging man can be found on all time frames and traded in many different markets.
Whilst the hanging man is very easy to spot on your charts, it does not form as often as the other patterns discussed in this lesson.
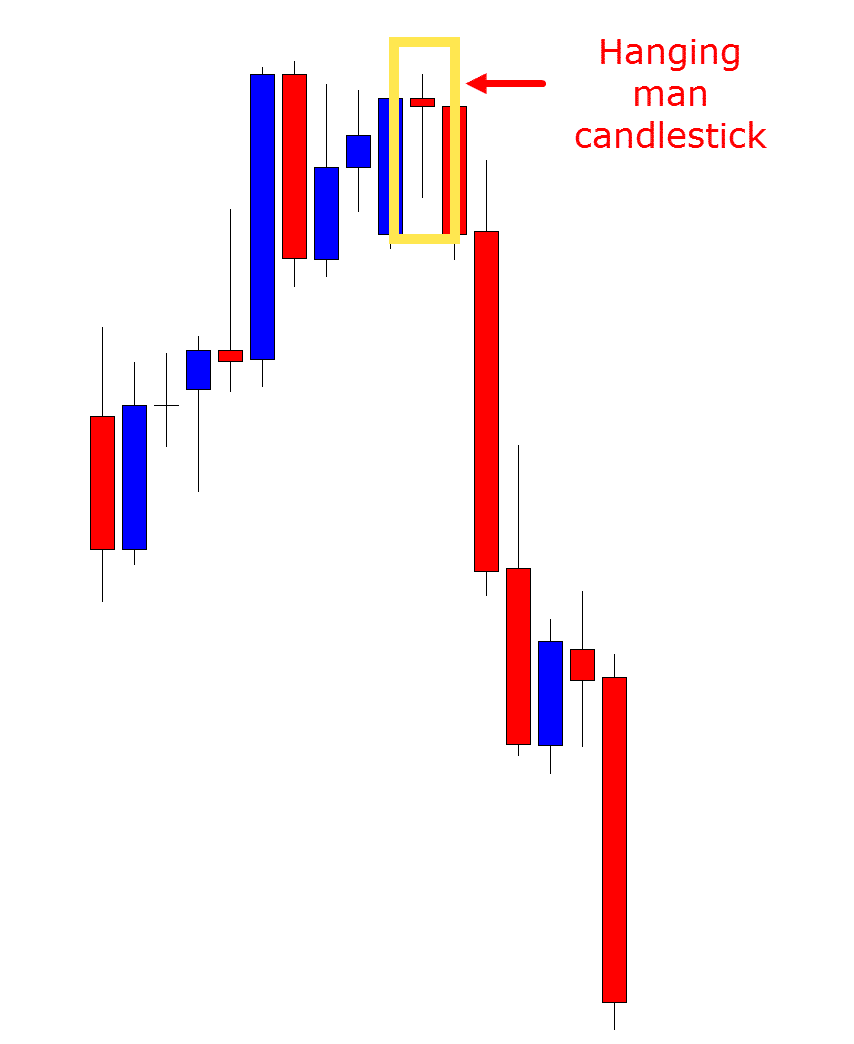
The hanging man is formed when price has been in an uptrend. The hanging man then forms a candlestick with a long lower wick and a small upper body.
The chart below shows a bearish hanging man candlestick pattern.

Lastly
Whilst there are many different bearish candlestick patterns you can use in your own trading you don’t need to know them all.
It is often best if you can find the patterns that suit your trading style and strategy and then master them, rather than trying to use every single candlestick pattern all at once.


Leave a Reply