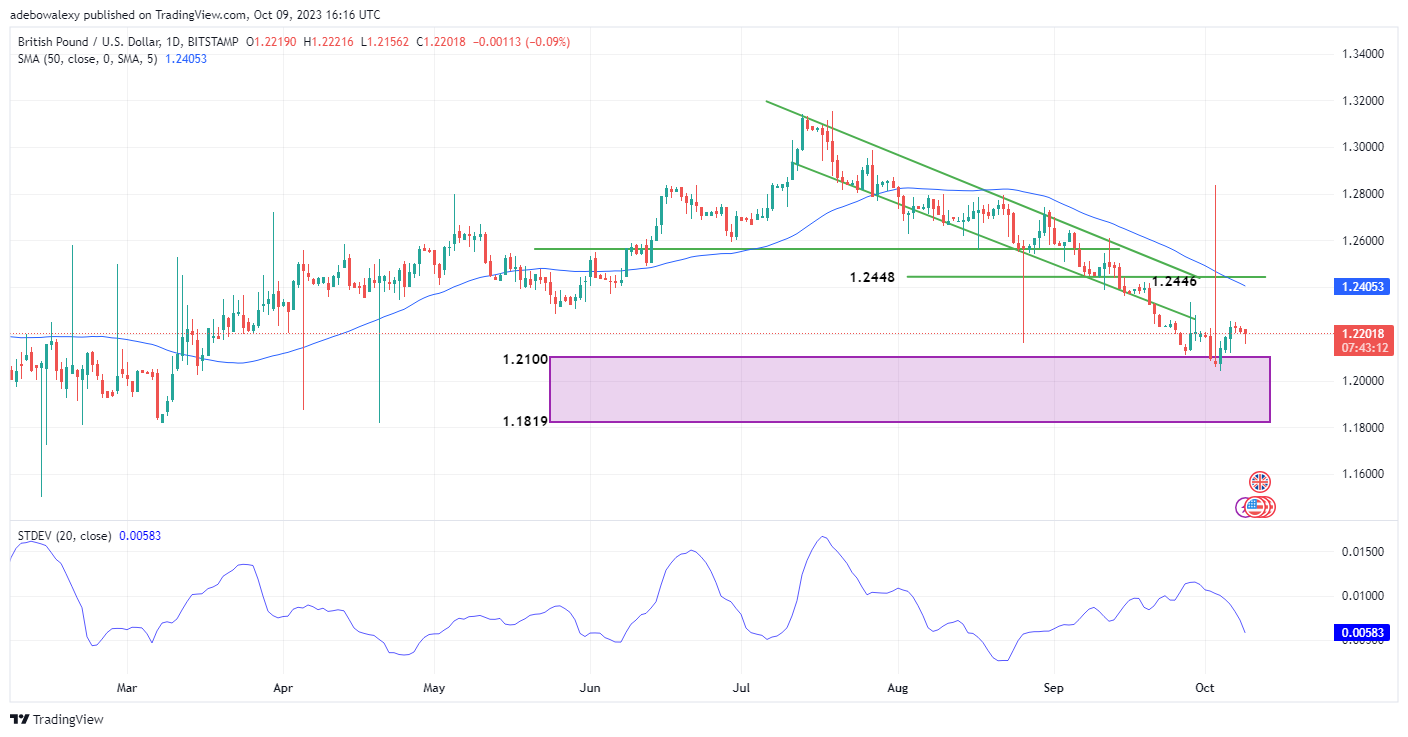
Towards the end of last week’s trading, GBPUSD buyers had attempted to cross significantly above the 1.2200 mark. But it appears that headwinds came back to life and have stayed in control of price movements till now, causing further price declines in this market.
Major Price Levels:
Resistance Levels: 0.6362, 0.6400, and 0.6450
Support Levels: 0.6330, 0.6300, and 0.6270

GBPUSD Recoils off the Resistance around the 1.2220 Price Level
Upside forces had earlier attempted a significant upside price correction through the resistance level at the 1.2200 mark in the GBPUSD daily market. However, no sooner than price action crossed the 1.2200 thresholds did headwind pushback at price action, initiating a smooth recoil back toward lower levels.
Nevertheless, price action as of the time of writing was still hanging above the 1.2200 mark by a thread. Meanwhile, the Standard Deviation (SD) curve holds a more gloomy outlook for this pair as its line is now plunging steeply downward from above the 0.000 mark. By implication, the SD curve is suggesting that price action is heading toward lower support.

Does GBPUSD Have a Fighting Chance?
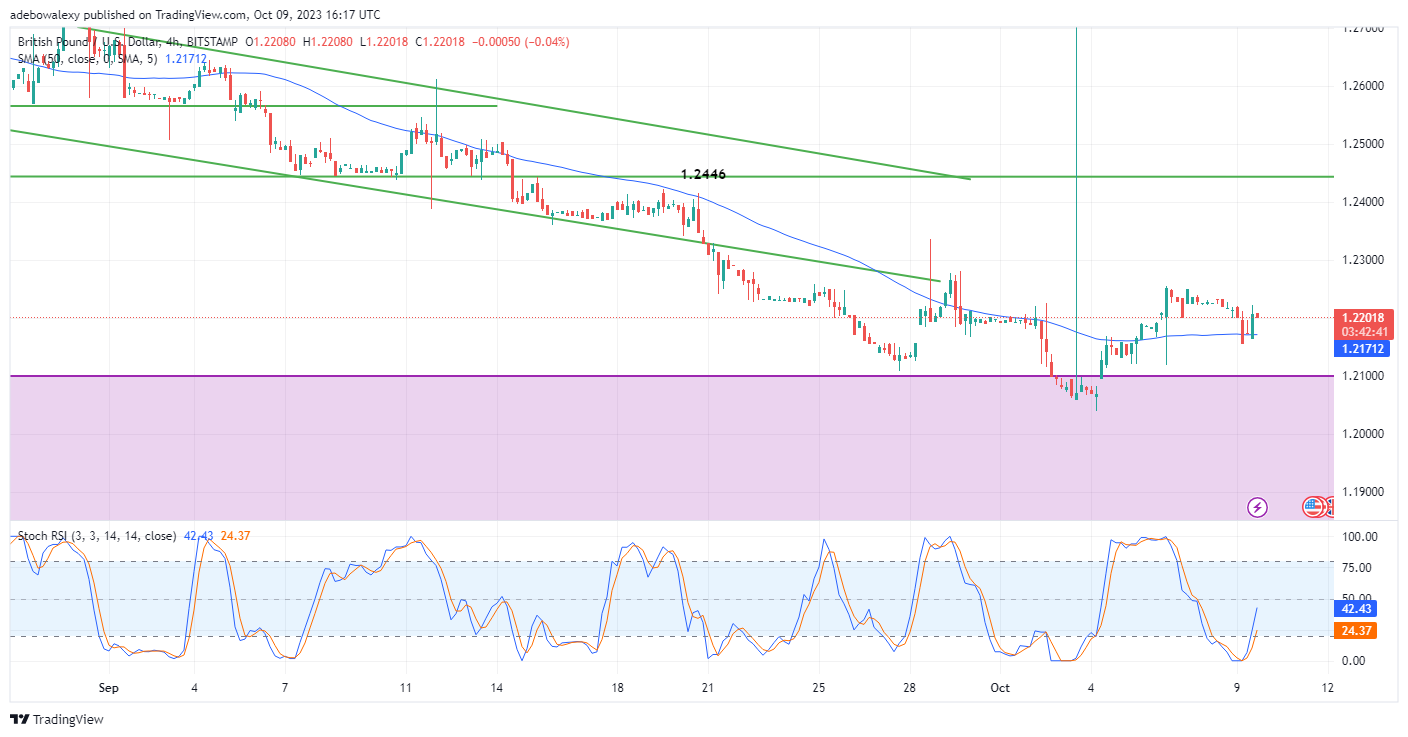
In a GBPUSD market of 4 hours, it appears that upside forces have made some notable attempts to end the perceived downward correction in this market. But unfortunately, it could be seen that headwinds are still fighting hard to stay in control.
A red-price candle with no upper and lower shadow has appeared for the ongoing trading session. This could have been considered as an attempt made by downward forces to cause a downward correction towards the 50-day MA, but the RSI lines are still pointing upward owing to the profits gathered in the previous session. Consequently, this suggests that upside forces may keep gaining momentum, which will cause this pair to keep correcting upwards towards the 1.2300 mark.
Do you want to take your trading to the next level? Join the best platform for that here.


Leave a Reply