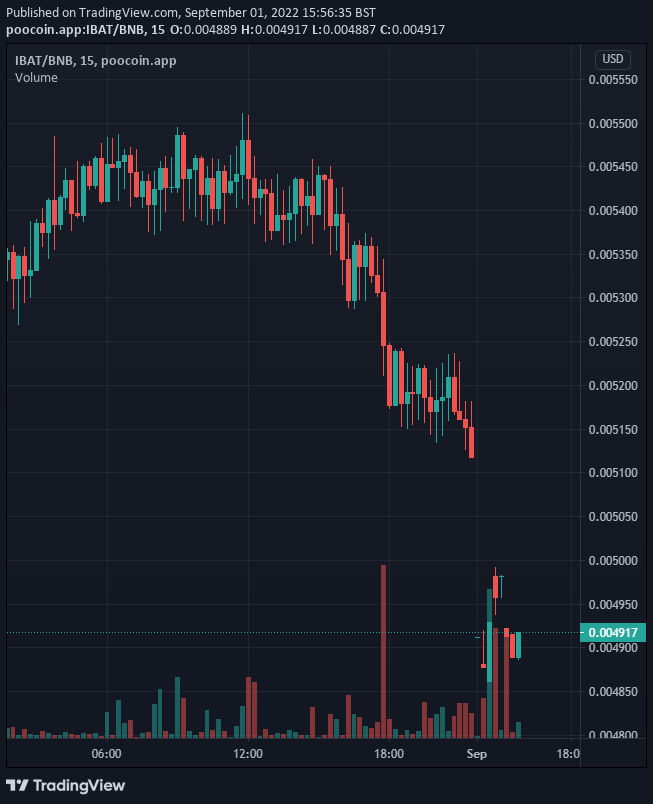
As the price action of Battle Infinity prepares for an upward performance, we notice that some of the recent candlesticks on the 1-hour timeframe chart are spinning tops. Spinning tops are candlesticks that signify a deadlock between bulls and bears. Buyers and sellers are in a serious struggle over the control of the market. This indicates a time of indecision as to the direction of price action for the sessions. Nonetheless, the buyers are still in the game. They are trying to regain ground in the market. At the moment they are holding up the price at the support level of $0.004896
Key Levels
Resistance: $0.00500, $0.005100 $0.005200
Support: $0.004800, $0.004700, $0.004600
Battle Infinity: Information From the Indicators
According to the information from the Stochastic RSI indicator, the price of Battle Infinity is being oversold at the moment. And that means a price upward retracement is imminent. At this time, short-term traders have to be on the watch to discover an opportunity to enter the trade. Once the faster line of the stochastic indicator rises from the overbought zone and the candle directly above the point at which the faster line intersects the slow line is bullish, that is the time to take action. Also, watch out for where the 9-day moving average crosses the 21-day moving average, that can be an opportune time to place the trade for a profitable return.
IBAT/USD Short-Term Trend: Bullish (15-minute chart)
Scaling into this timeframe, we see several dramatic swings that made the lines test the oversold region of the stochastic indicator several times. This reveals a strong effort by bulls to regain their ground in the market. Times of downward performance of price are times when prospective investors should take advantage of the cheap price to enter the market. Also, experienced investors can diversify their investments to create an additional source of income for themselves.
Want a coin that has a huge potential for massive returns? That coin is Battle Infinity.
Buy IBAT now.


Leave a Reply