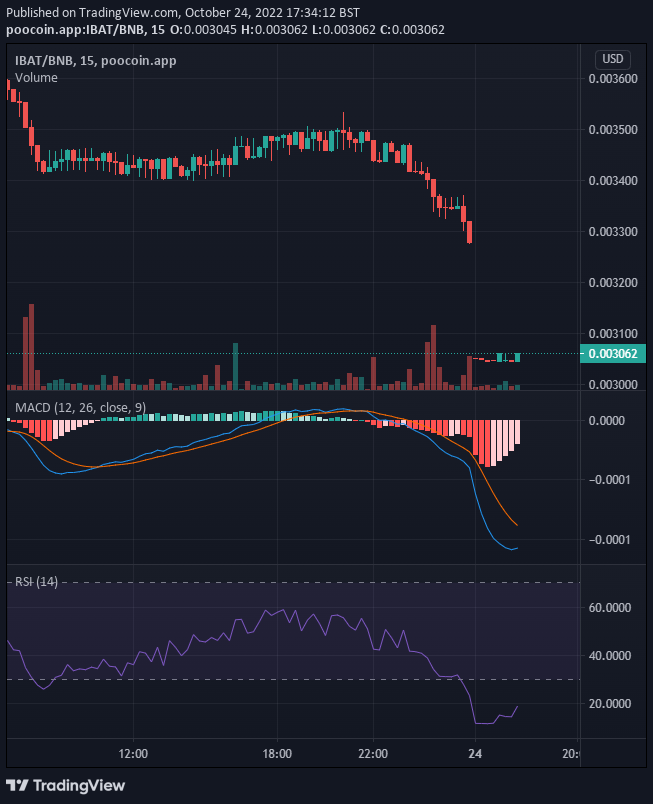
The IBAT market shows a bit of response to the upside in today’s market. Initially, the market was in the oversold territory. But the indicators are now showing us how the price of the market is responding to the upside.
Key Levels
- Resistance: $0.0038, $0.0040, $0.0045
- Support: $0.0025, $0.0020, $0.0019
IBAT/USD: The Indicators’ Outlook
The price of Battle Infinity has retraced the support level of October 14th which was at around $0.003062. The market was salvaged at this point, thanks to the bullish market activities. This has prevented the price from falling further below this level. The MACD indicator now has pink histograms which are reducing in height. This will eventually culminate into a bullish histogram as the market progresses.

IBAT/USD Short-Term Outlook: Bullish Recovery (15-minute chart)
The Bearish activities have sent the price to the oversold region. This means that we should expect a price retracement or a trend reversal soon. Investors should watch out for when the fast line of the MACD crosses above the slow line so that they to place a long trade. Due to the downtime in the IBAT market, the faster line of the MACD is far below the slower line. But from the RSI indicator, we can see a ray of hope as the RSI line is now retracing an upward position.
Want a coin that has a huge potential for massive returns? That coin is Battle Infinity.
Buy IBAT now.


Leave a Reply