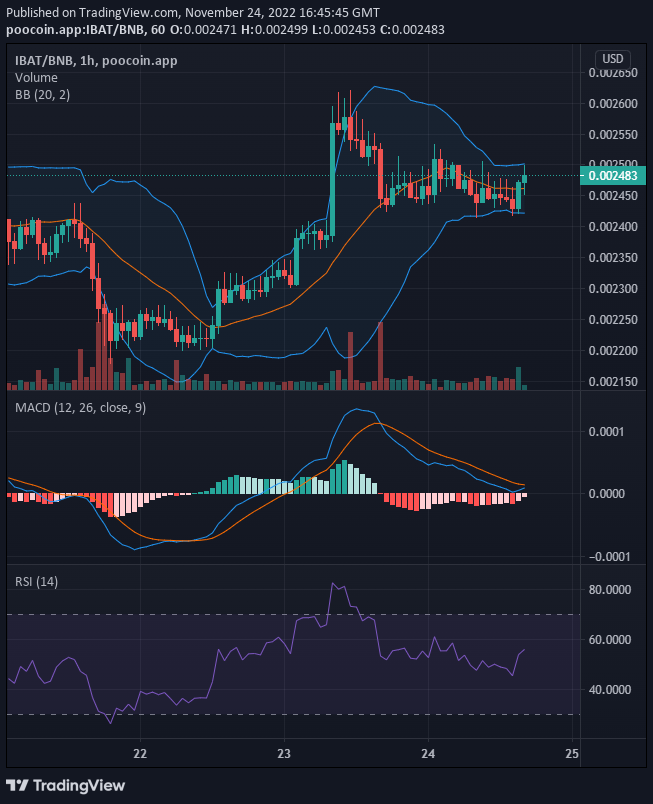
Battle Infinity’s massive bullish move of the last trading session triggers activities in the bear market. The trader began to sell as the market attain the $0.0026 level and as a result, the bear market pushed the price down until buyers were able to dam the falling price with a strong support level at $0.002428. And this support level still holds even in today’s market.
Key Levels
- Resistance: $0.0027, $0.0028, $0.0029
- Support: $0.0022 $0.0021, $0.0020
IBAT/USD: The Indicators’ Outlook
Currently, the buyers are gathering momentum for the breaking of the strong resistance at $0.0025. The Bollinger indicator portrays the narrowing price channel which will precede a bullish price breakout. This is because the price action has crossed above the 20-day moving average in preparation for a bullish price breakout. The MACD indicator with the faded red histogram means a weakening bearish market. And the weakening bearish market will give way to the bullish market.

Battle Infinity Short-Term Outlook: Bullish Recovery (15-minute chart)
The price resistance around $0.0025 is strong. This is because, despite the bullish move, not much of a response was seen from the upper band of the Bollinger indicator. The price rebounded to the $0.002455 price level after the bullish price was rejected at the resistance level. However, buyers have secured another support level which is above the 20-day moving average. From this level, they will be able to charge at the $0.0025 price level.
Want a coin that has a huge potential for massive returns? That coin is Battle Infinity.
Buy IBAT now.


Leave a Reply