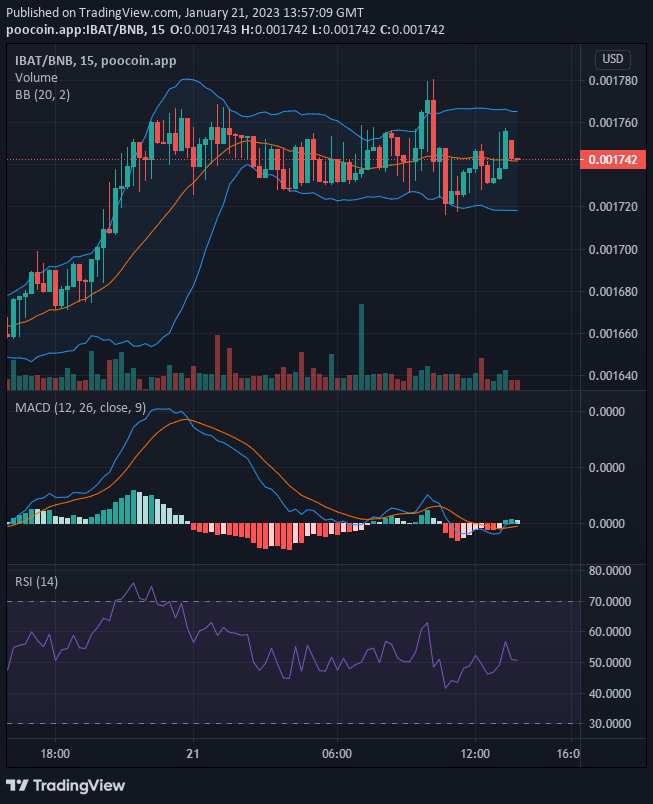
After the Battle Infinity bull market made it above the $0.0017 price level towards the end of the last session, they faced exhaustion as they approached $0.001750. At the start of today’s trading session, the bullish price was eventually rejected. However, a new support level was formed in proximity to the key resistance level.
Key Levels
- Resistance: $0.0022, $0.0021, $0.0020
- Support: $0.0017, $0.0016, $0.0015
IBAT/USD: The Indicators’ Outlook
With the new support level at $0.001717, there is a probability that the bulls will break the resistance and continue to push the price to the upside. But according to the information from the indicators, the two market forces are matching up. Bulls are catching up with the bears, and this is illustrated by the Bollinger Bands indicator with contracting bands. The MACD lines are moving horizontally above level zero. This is a pointer that the bulls are having the upper hand even though the market is at gridlock near the key resistance level. The bearish position in the market is now under pressure.

Battle Infinity Short-Term Outlook: Bullish Recovery (15-minute chart)
From this point of view, the market is still very volatile, and both opposing lines are very formidable. The Bollinger Bands Indicator testifies to this with the widened band, which can also stand for the width of the price channel in this timeframe. The price is still above the 20-day moving average, so the bulls will likely capture the $0.0018 price level before today’s session runs out.
Want a coin that has a huge potential for massive returns? That coin is Battle Infinity. Buy IBAT now.


Leave a Reply