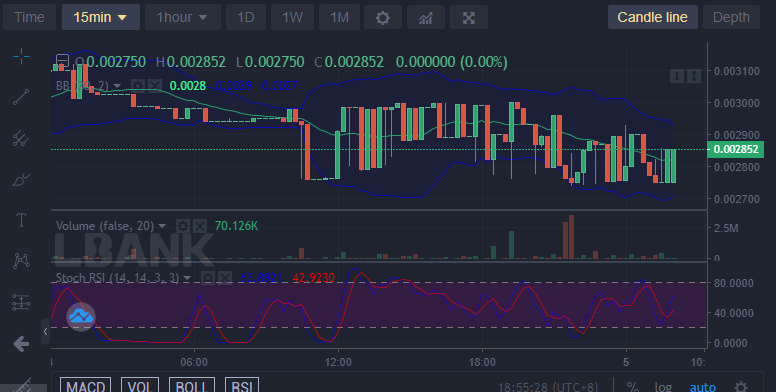
Battle Infinity has picked the support level of $0.002852 as the basis for its upward rebound or retracement. This is the third time the price will bounce off this support level. Each time it rebounded to the upside it does so with a very strong bullish momentum.
Key Levels
Resistance: $0.003000, $0.00320, $0.003400
Support: $0.002800, $0.002500, $0.002000
IBAT/USD: The Indicators’ Outlook
As we can see from the chart, the Bollinger bands are much wider apart from each other. This points to high volatility in the market. It also points to growing interest among traders to buy and sell. The wide bands increase the probability of market performance in favour of the bulls. The Relative Strength Index measures 57% which is a bullish market. Although the bullish price at $0.002852 is lesser than that of yesterday, the price will still go up.

IBAT/USD Short-Term Outlook: Bullish Recovery (15-minute chart)
In this indicator, the price has crossed above the basis line of the Bollinger band indicator. However, at this point, bulls are met with much resistance from the bears which makes the progress of the market pegged at the current price. Buyer are relentless as the battle continues between the two forces
Want a coin that has a huge potential for massive returns? That coin is Battle Infinity.
Buy IBAT now.


Leave a Reply