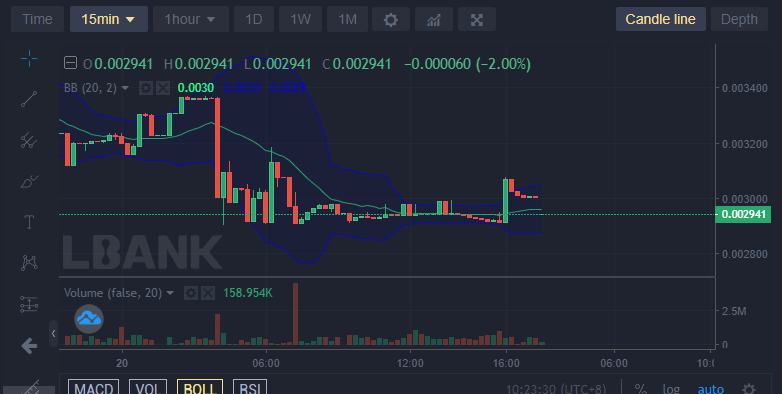
Towards the end of the previous trading session, Battle infinity formed a new support at $0.003110, this was anticipated to be the pivot for the next bullish trend. As expected we saw the bullish trend, but it was cut short at the $0.003365 price level. This resulted in a bearish market. But the bulls also cut short the bearish market with their support price of $0.002948.
Key Levels
- Resistance: $0.0038, $0.0040, $0.0045
- Support: $0.0025, $0.0020, $0.0019
IBAT/USD: The Indicators’ Outlook
Bulls are proving strong as they have pegged the bearish progress at the current price. This will eventually result in a bullish trend as the bulls become stronger. The upper and lower band of the Bollinger indicator are widening in preparation for the bullish breakout. In the Stochastic RSI indicator, the two lines are in the bullish zone measuring 72%. The MACD indicator is a much slower indicator than the Stochastic, but as its fast line crosses its slow line below the market equilibrium level, it signals a bullish recovery.

IBAT/USD Short-Term Outlook: Bullish Recovery (15-minute chart)
In this time frame, the MACD indicator and the RSI indicator point to a bullish market. We can see that the price has risen from the $0.002902 price level to continue its bullish performance. But the forces of demand and supply still battle for price control at the current price.
Want a coin that has a huge potential for massive returns? That coin is Battle Infinity.
Buy IBAT now.


Leave a Reply