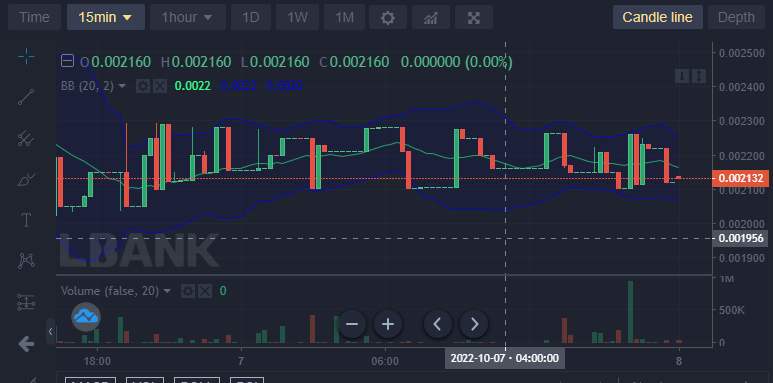
Battle Infinity entered into sideway ranging market trend in the 13th hour of yesterday’s trading session. As the market progresses, the support and resistance increase in proximity to each other (they seem to converge) as the pressure to buy and sell reduces.
Key Levels
Resistance: $0.002400, $0.00250, $0.002600
Support: $0.002000, $0.001900, $0.001800
IBAT/USD: The Indicators’ Outlook
In the 11th hour of today’s trading session, the market finally made a very strong decisive move to the upside reaching the $0.002400 price level. It is expected that the bands of the Bollinger indicator widen out in response to this new development in the market so that we can be sure that the market will keep up the bullish trend. In response to this new market development, the MACD line is about to cross out of the negative zone just as the histograms continue to perform in the positive zone.

IBAT/USD Short-Term Outlook: Bullish Recovery (15-minute chart)
To confirm the bullish price breakout, the Bollinger band in this timeframe is widening out its bands to accommodate the activities of the price actions. Soon this will reflect in the bigger timeframe as the histograms and the MACD lines are now performing on the positive section of the indicator.
Want a coin that has a huge potential for massive returns? That coin is Battle Infinity.
Buy IBAT now.


Leave a Reply