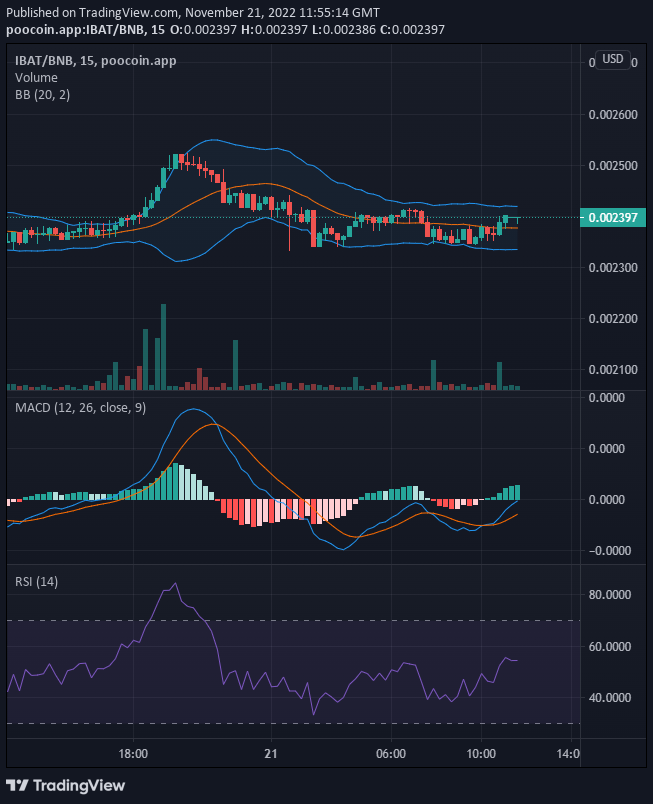
Towards the end of the last trading session, Battle Infinity had a massive bullish breakout. The bulls reached the $0.0025 level. However many traders targeted the price level as the point at which they will take their profits. And because of this, the market went the bearish way until bulls were able to secure $0.002349 as the support level for the market. The price is now back at $0.0024.
Key Levels
- Resistance: $0.0027, $0.0028, $0.0029
- Support: $0.0023, $0.0022 $0.0021
IBAT/USD: The Indicators’ Outlook
Both the MACD and the RSI indicators now carry a bullish price recovery sentiment. The RSI indicator measures 51 as the momentum. This is telling us that the market is currently standing between the buyers and the seller (equilibrium price). The Bollinger bands widen as it yet continues its movement horizontally, and the price actions settle in the middle of the indicator along with the 20-day moving average. The bulls now have a higher support price level and this will form the basis for another upward price action.

Battle Infinity Short-Term Outlook: Bullish Recovery (15-minute chart)
The bullish support price level is at $0.002345, but the market is faced with resistance at $0.002402. This closeness between the support and resistance level is portrayed by the Bollinger indicator with its narrowing bands. As more buyers come into the market, the market will break out to the upside.
Want a coin that has a huge potential for massive returns? That coin is Battle Infinity.
Buy IBAT now.


Leave a Reply