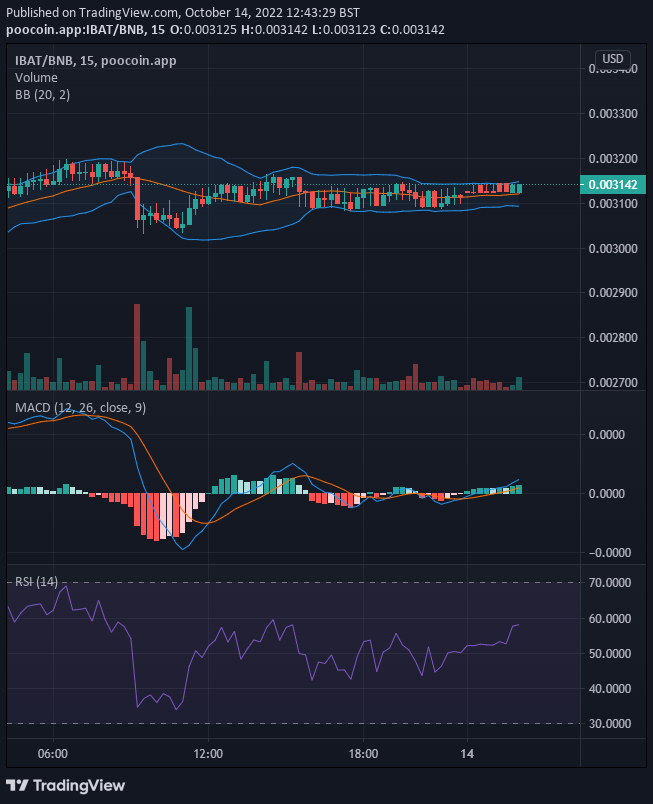
IBAT/USD price began to pull back at the height of $0.0032 on the 10th of October. By the looks of the three consecutive bearish candle that followed the peak price of $0.0032, we would have think that the control of the market would fall to the hands of the sellers. The buyers were still strong to stop the price from falling.
Key Levels
- Resistance:$0.0035, $0.0040, $0.0045
- Support: $0.0025, $0.0020, $0.0019
IBAT/USD: The Indicators’ Outlook
The Bollinger band indicator and the price action are now moving straight of an horizontal fashion. And the outlook of the candlestick pattern portrays faceoff between the two forces of the market. This makes the market to face directional indecision as the price appears to be stucked at the current price. The negative histograms are showing signs of bullish recovery, while the MACD lines are falling, retracing a lower level. This may be due to the fact that the price pull and push is taking much time to culminate into a breakout.

Battle Infinity Short-Term Outlook: Bullish Recovery (15-minute chart)
The price action is just moving around the basis line of the Bollinger indicator due to the indesicion. The last two bullish candle appears beside each other instead of appearing above the previous candle. That means the price opened at the same time it did in the previous session. The bearish candles that came before these bullish candles did the same thing. The Bollinger bands are converging again. We expect that at the peak of the convergence, the price will breakout in a bullish way.
Want a coin that has a huge potential for massive returns? That coin is Battle Infinity.
Buy IBAT now.


Leave a Reply