The Battle Infinity price dip was what followed the strong bullish market trend which started on the 15th of October and ended on the 17th of October. The uptrend came to an end when the price reached the high price level of $0.003828. It was at this point sellers engaged the buyers in a struggle for market dominance. The buyers held up against them on the 17th of October, but not for long as they soon lost their grip on the market.
Key Levels
- Resistance: $0.0038, $0.0040, $0.0045
- Support: $0.0025, $0.0020, $0.0019
IBAT/USD: The Indicators’ Outlook
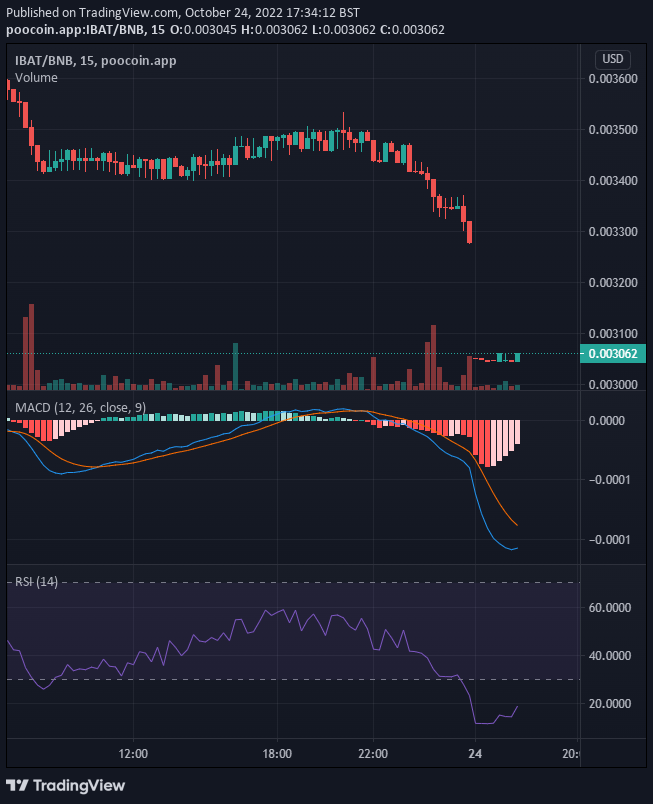
The price continued to slide downwards until bullish activities were able to prevent a further fall in price value. At the current price, the tug-of-war has been going on for days. But the buyers were still able to prevent further bearish market. Both the RSI and the MACD signal an imminent rise in price because the indicator lines are in the oversold region.

IBAT/USD Short-Term Outlook: Bullish Recovery (15-minute chart)
The trading chart from this standpoint reveals that there are more bearish activities in the market than bullish activities. Even the strong bullish move that we see in the first 15 minutes of the 12th hour was almost lost to a bearish push before that session was over. However, the MACD still says the bullish recovery is in progress
Want a coin that has a huge potential for massive returns? That coin is Battle Infinity.
Buy IBAT now.


Leave a Reply