After Battle Infinity‘s bullish price return above the $0.0017 price level, they failed to go beyond the new supply line at $0.001762. The bearish resistance proves impregnable, and as a result, the demand line was forced to fall back below $0.0017 to find support for the bull market.
Key Levels
- Resistance: $0.0022, $0.0021, $0.0020
- Support: $0.0017, $0.0016, $0.0015
IBAT/USD: The Indicators’ Outlook
Currently, the indicators are bearish. But when we look at the Relative Strength Index, the RSI line seems to be telling us that the bull market has found its support level. The RSI line is beginning to move sideways, measuring 32.4 for the market’s momentum. Although 32.4 is a strong sell signal, the bulls have halted the aggressive bear market. They now need to regain balance and push the market to the upside.

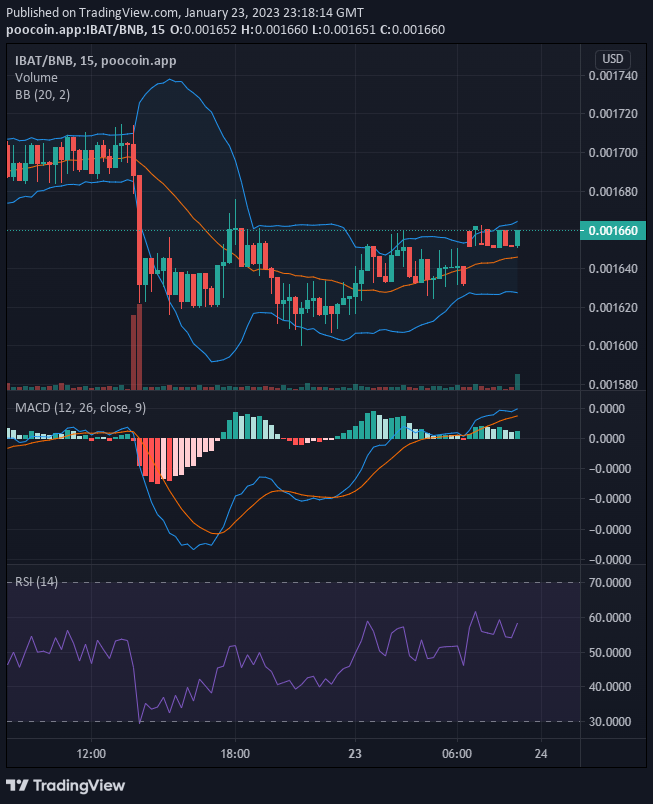
Battle Infinity Short-Term Outlook: Bullish Recovery (15-minute chart)
In the 15-minute timeframe, the buying pressure is becoming stronger. The Bollinger Bands indicator is reflecting the bullish recovery through the upper band of the indicator. With the 20-day moving average following along with this development, we can be sure that the bullish recovery is in progress. Before the next session, the price should be back at the key resistance level.
Want a coin that has a huge potential for massive returns? That coin is Battle Infinity. Buy IBAT now.


Leave a Reply