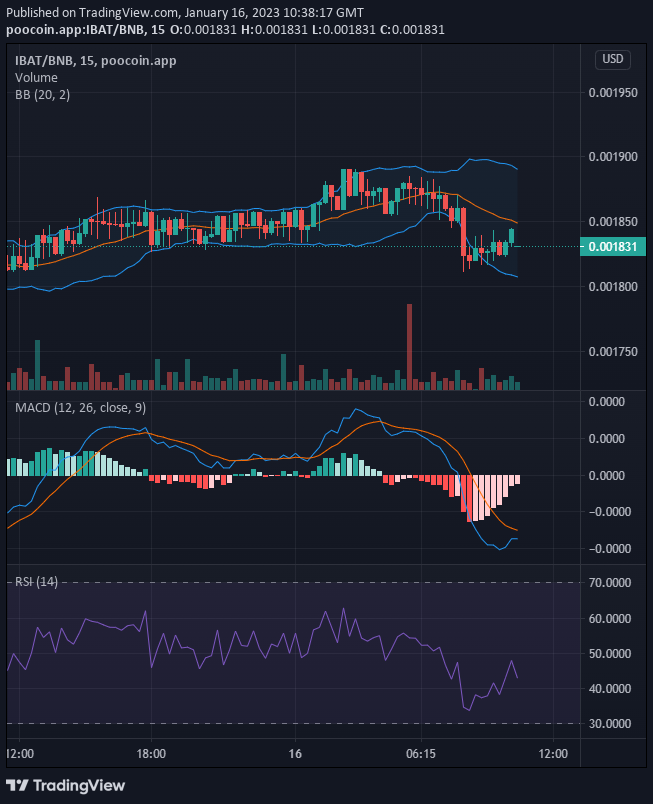
Battle Infinity’s bullish price was rejected at $0.001888, which was in proximity to $0.0019. Strong bearish activity in this price zone sent the price spiralling downward. The bear market, which was illustrated by momentum candlesticks, was stopped by the strong bullish support at $0.001830.
Key Levels
- Resistance: $0.0022, $0.0021, $0.0020
- Support: $0.0017, $0.0016, $0.0015
IBAT/USD: The Indicators’ Outlook
The Bollinger Bands Indicator portrays the abortive upward movement due to the strong selling activities in the market. But, the bearish price is being rejected at $0.001830 and is very likely to become the new support level. This new support price level is going to form the basis for another bullish price action. But for now, the bulls are still in the process of trying to establish the support level; ensuring that the bear market did not go beyond $0.001830.

Battle Infinity Short-Term Outlook: Bullish Recovery (15-minute chart)
The MACD indicator shows the bull market in recovery with its progressive histograms. The faded red histograms, which are signs of bullish activity, are approaching the threshold of the buy zone. And we are about to have a bullish crossover of the MACD lines. The bulls are very likely to recapture the $0.0019 price level within today’s daily trading session.
Want a coin that has a huge potential for massive returns? That coin is Battle Infinity. Buy IBAT now.


Leave a Reply