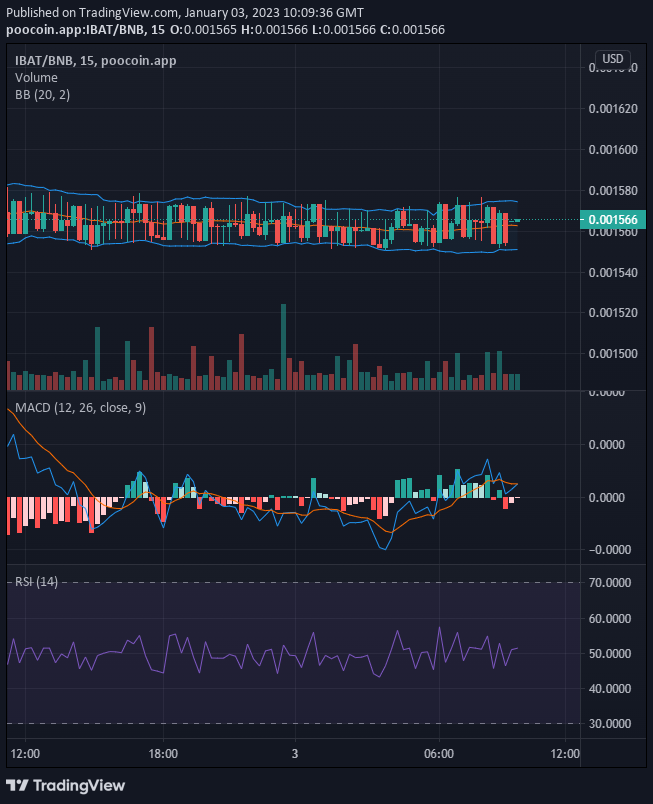
In the last session, Battle Infinity‘s bulls hit a brick wall at $0.001580. And as the bullish price was rejected, the price fell below $0.001560, and the bulls regrouped at $0.001549, from here, the bullish price rallied.
Key Levels
- Resistance: $0.0022, $0.0021, $0.0020
- Support: $0.0015, $0.0014, $0.0013
IBAT/USD: The Indicators’ Outlook
The MACD indicator now has a bullish crossover in the sell zone. This is an indication of a bullish recovery attempt. However, the price channel illustrated by the Bollinger Bands indicator is moving in a downward direction since the price has fallen below $0.001560. Currently, the bullish price recovery has brought the market back to the point of equilibrium, but for the general direction of the market to change from a downward direction, the bulls need to capture $0.001580.

Battle Infinity Short-Term Outlook: Bullish Recovery (15-minute chart)
The information from the 15-minute standpoint suggests indecision in the market. However, the Bollinger Bands Indicator shows through the upper band that the bulls are trying to take the market. Before the day’s session runs out, bulls may reclaim $0.001566.
Want a coin that has a huge potential for massive returns? That coin is Battle Infinity. Buy IBAT now.


Leave a Reply