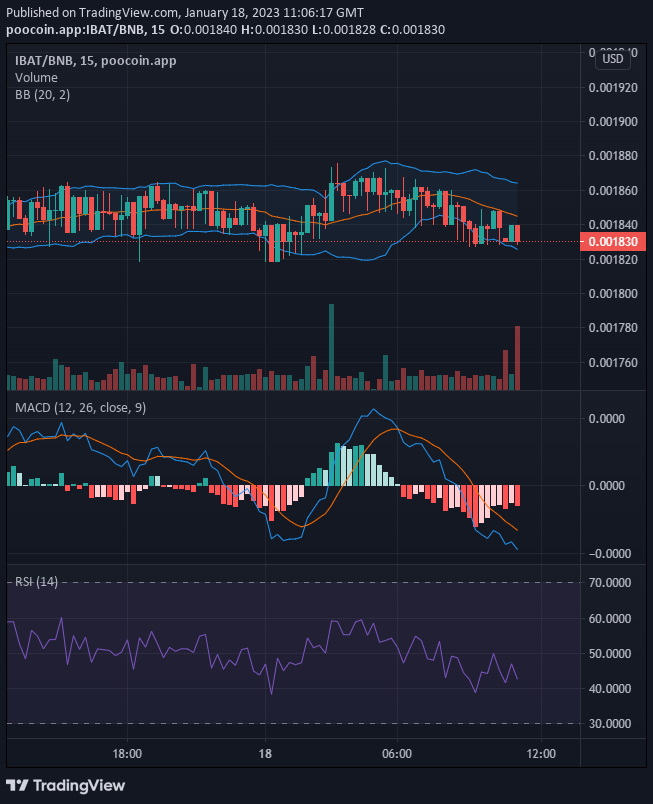
After the bear market hit the brick wall at $0.001834, the Battle Infinity market experienced a significant bullish surge. We have three strong bullish candlesticks illustrating the aggression in the bull market as they aim to capture the $0.0019 price level. However, the aggressive bullish move failed to make it past the $0.001832 price level. The fact that the bullish move was cut short at that level shows us that the bears are also very formidable.
Key Levels
- Resistance: $0.0022, $0.0021, $0.0020
- Support: $0.0017, $0.0016, $0.0015
IBAT/USD: The Indicators’ Outlook
The bull market has returned to its base after failing to break through a key resistance level. And because of this, the Bollinger bands indicator signals that the market is moving around the equilibrium price but with high volatility. Both market forces are equally formidable. Currently, the pressure is on the bulls as the market price is below the 20-day moving average and also closer to the key support level.

Battle Infinity Short-Term Outlook: Bullish Recovery (15-minute chart)
From this point of view, the Bollinger Bands Indicator now illustrates through the price channel that the market is now moving in a downward direction. This was after the market’s price failed to break the $0.001840 and come up above the 20-day moving average. There is more reason for the bulls to be concerned about not losing their position in the market because there is a sharp spike in the volume of trade in the selling direction. However, the bulls are holding to the $0.001830 level as their last stronghold.
Want a coin that has a huge potential for massive returns? That coin is Battle Infinity. Buy IBAT now.


Leave a Reply