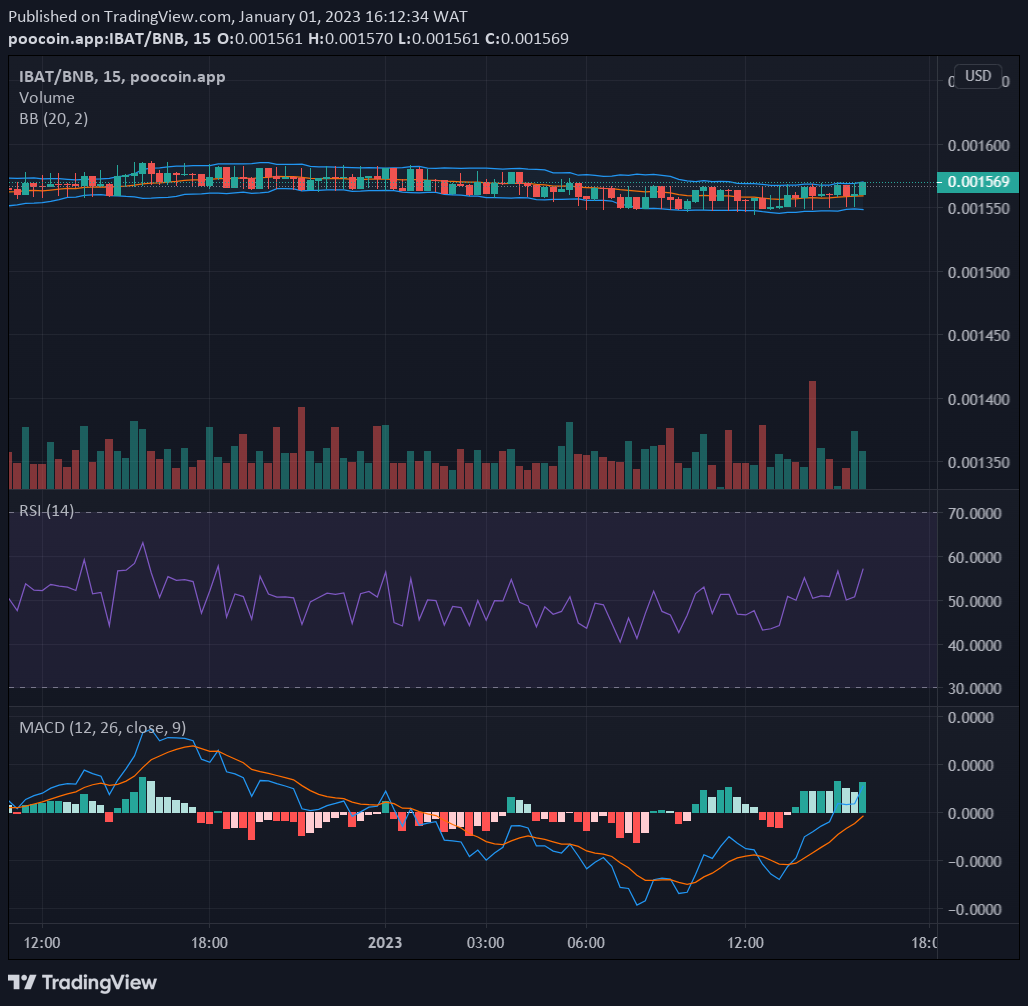
The recent candlesticks on the chart portray the intensifying market struggle between the bulls and the bears in the Battle Infinity market. Candlesticks with smaller bodies and longer wicks show pressure being mounted on the market from both sides. And although the IBAT market is currently receiving pressure from both sides, the general direction of the market is horizontal because the forces are becoming evenly matched.
Key Levels
- Resistance: $0.0022, $0.0021, $0.0020
- Support: $0.0015, $0.0014, $0.0013
IBAT/USD: The Indicators’ Outlook
As the bull market catches up with the bear market, the Bollinger Bands Indicator is trying to take up an upward movement. The price action now catches up with the 20-day moving average. In the same way, the RSI line is at the border of the bullish zone in the indicator. Bulls are coming into the market, and they are turning the tide of the price in their favour. However, to fully turn the direction of the market to the upside, the price action must come up above the 20-day moving average in the hourly chart.

Battle Infinity Short-Term Outlook: Bullish Recovery (15-minute chart)
In the 15-minute Battle Infinity chart, the price action has now come up above the 20-day moving average. Though the price channel still appears to be moving sideways, the bulls now have the upper hand because the price action is above the 20-day moving average. Bulls now need a solid higher support level that will form the basis for further upward actions. As the bulls gather momentum, $0.0016 is the target before the next daily session.
Want a coin that has a huge potential for massive returns? That coin is Battle Infinity. Buy IBAT now.


Leave a Reply