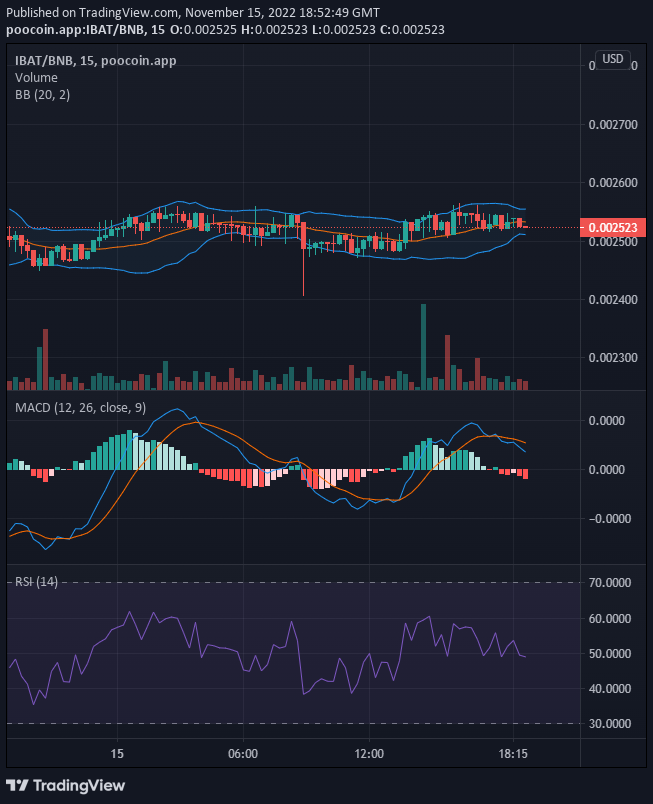
Battle Infinity suffered a bullish price rejection at the $0.0026 price level and this triggered a bearish run that was cut short at the $0.002456 price level. This new support is higher than the $0.0024 support from where the price rally attempt began (in the first place). From this new support level, the price is rising (setting targets at $0.0026).
Key Levels
- Resistance: $0.0027, $0.0028, $0.0029
- Support: $0.0024, $0.0023, $0.0022
IBAT/USD: The Indicators’ Outlook
As the price of IBAT continues to rise, the bulls face a new resistance level at $0.002549. This should not be much of a problem for buyers as bullish momentum continues to gather as the price rises or gets closer to the resistance. To confirm this sentiment, the price activities on the chart are forming an ascending wedge triangle pattern. This type of market behaviour usually results in a bullish breakout. The Bollinger band indicator portrays the upward-shifting support levels with the rising of its lower band.

Battle Infinity Short-Term Outlook: Bullish Recovery (15-minute chart)
From this point of view, we see new higher bullish price support set at $0.002520. Now we see bulls and bears getting even in the struggle for price control. As the faceoff gets intense the 20-day moving average portrays indecision as price action performs through the line. And the RSI now point to 50 as the measure of the market’s momentum. But the MACD brings up an indication that support a bearish market.
Want a coin that has a huge potential for massive returns? That coin is Battle Infinity.
Buy IBAT now.


Leave a Reply