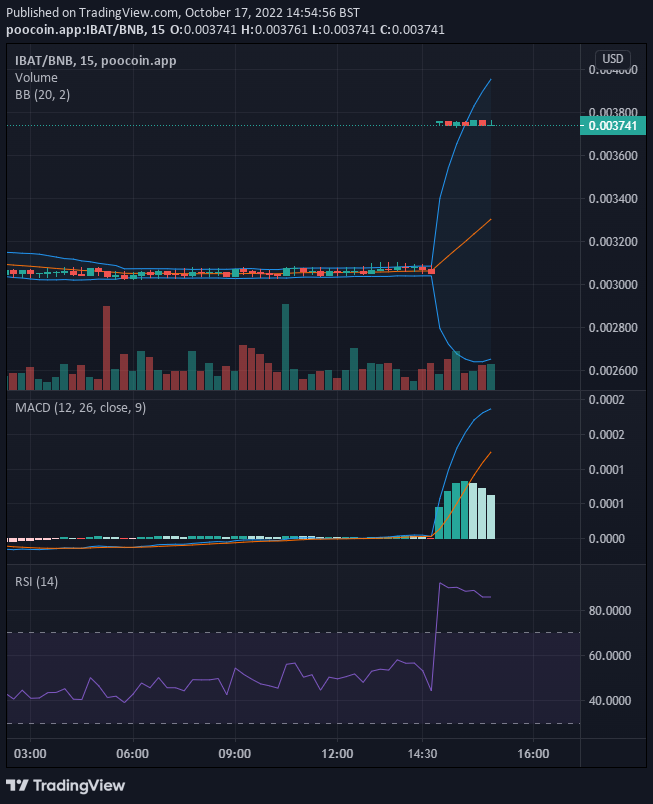
There was a period of consolidation in the Battle Infinity market. Between the 11th of October to the 16th of October, the market move in a sideway ranging market. After this consolidation period and in today’s market, we can see the market opening at a much higher price. Bulls are supporting this high price and preventing a fall from that height.
Key Levels
- Resistance:$0.0038, $0.0040, $0.0045
- Support: $0.0025, $0.0020, $0.0019
IBAT/USD: The Indicators’ Outlook
The MACD of today’s trading activities shows a sharp and almost vertical uprise in the lines of the indicator. Before now, the negative histograms and the two MACD lines appears to be converging with each trading daily session passing. This is a strange behaviour because the lines should move in an upward pattern as the negative histograms reduce. The market behaves this way because of the price consolidation.
The sharp spike in the market today, sent the RSI line into the overbought at 86.6%. And now we can see the slight pullback.

IBAT/USD Short-Term Outlook: Bullish Recovery (15-minute chart)
From the 15minute point of view, the Bollinger band indicator follows the price movement as it rises thereby keeping the price activities within the boundary of the indicator. This can have two meanings: the widened band provides more room for bullish performance in the market, it is also a sign of an in increase in the volatility of the market as the volume of trade increases. But as the IBAT market forms a support at the current price, we expect this to be the basis for the bullish trend.
Want a coin that has a huge potential for massive returns? That coin is Battle Infinity.
Buy IBAT now.


Leave a Reply