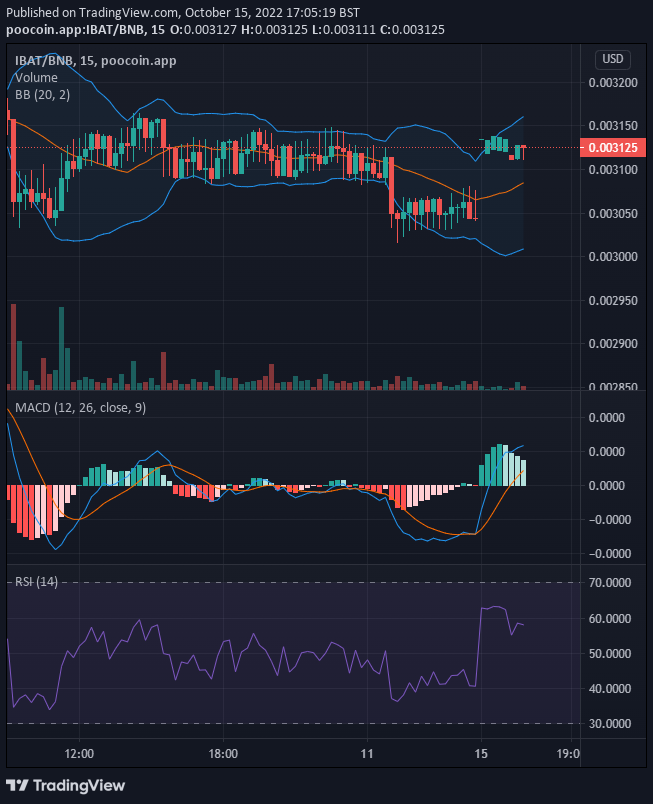
The outlook of the candlestick in the IBAT market portrays serious pressure on both ends. But, from the 11th of October to the 14th of October, none of the two stakeholders in the market could significantly influence the direction of the price in its favour. However, if we look closely at the market from the 11th to the 14th, we will notice a slight shift to the upside. This means that the buyers are becoming stronger. And as a result of this, today the 15th of October, the price leapt up to take a new support level at 0.003118.
Key Levels
- Resistance: $0.0035, $0.0040, $0.0045
- Support: $0.0025, $0.0020, $0.0019
IBAT/USD: The Indicators’ Outlook
In previous articles, we discovered a bearish divergence between the price action and the lines of the MACD. In today’s market, we can see that the market seems quick to recover from the aftermath of the bearish divergence. The lines of the MACD indicator are making to retrace an upper level, thus cutting short the bearish trend.

Battle Infinity Short-Term Outlook: Bullish Recovery (15-minute chart)
The widened Bollinger band signifies an increase in interest to trade in the Battle Infinity market at this time. In the Moving Average Convergence and Divergence indicator, there was a sharp recovery of the MACD line and the MACD signal line from the bearish zone to the bullish zone. This is due to the sharp bullish market performance that we see in today’s market. However, the faded green histograms have become a source of great concern as it signifies bearish activities
Want a coin that has a huge potential for massive returns? That coin is Battle Infinity.
Buy IBAT now.


Leave a Reply