Battle Infinity‘s price started pumping on the 3rd of November. The price pump started exactly as the daily session opened on the 3rd of November. The price continued pumping for the whole of the day and half of the day on the 4th (that is yesterday). Then the price settled at the higher price level of 0.003363.
Key Levels
- Resistance: $0.0035, $0.0036, $0.0037
- Support: $0.0028, $0.0027, $0.0026
IBAT/USD: The Indicators’ Outlook
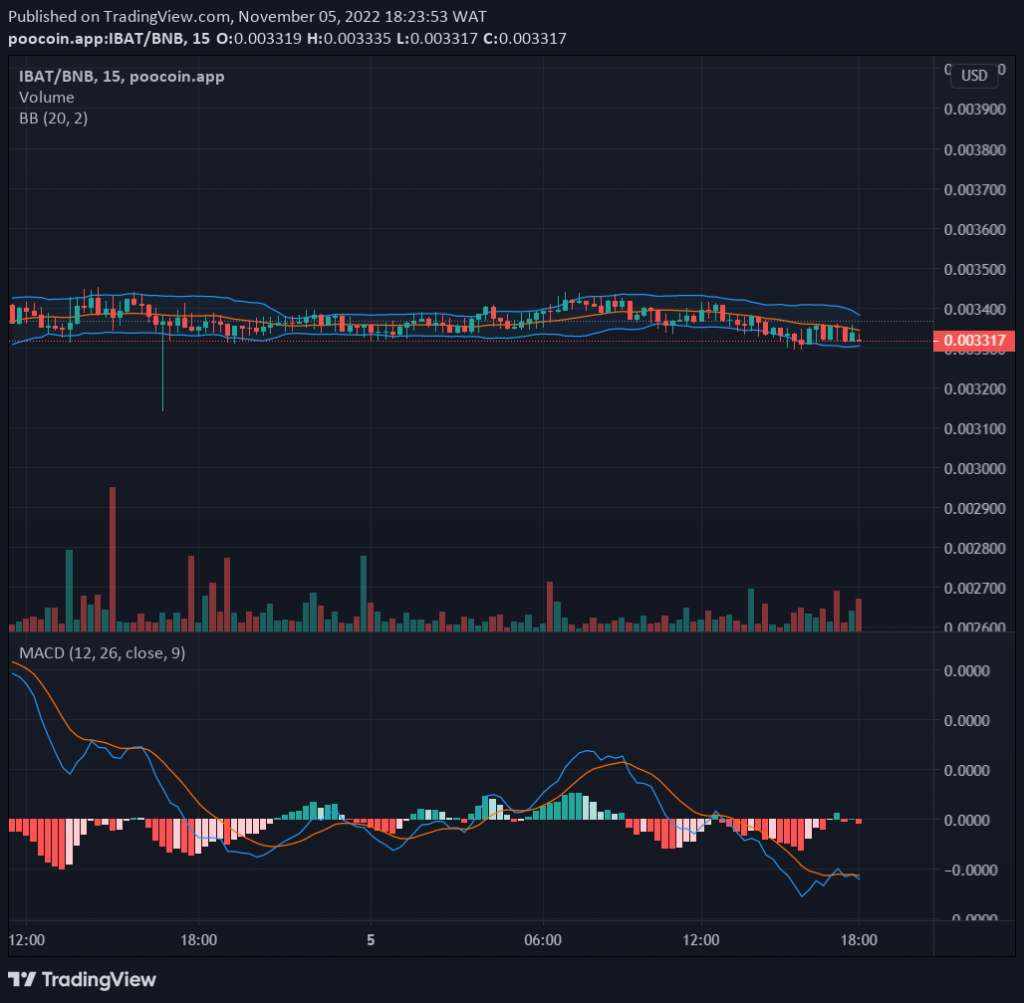
At the new price level, we have seen demand and supply struggle since yesterday for market dominance. The ascending price channel of the Bollinger band has changed to a sideway horizontal moving price channel. The latest bearish histogram in the MACD indicator is now showing weakness as the Battle Infinity bulls market is preparing to take over. From the new price level, the bullish market will take off again.

Battle Infinity Short-Term Outlook: Bullish Recovery (15-minute chart)
From the MACD indicator, we can see how the price is recovering. The MACD line has crossed over the MACD signal line. The two lines now face an upward position. Although the general outlook of the Bollinger indicator from this timeframe is a horizontal moving market, the price action is about to cross above the Bollinger Simple Moving Average. Once the bulls market conquers the $0.0032 level, their next stop will be the $0.0034.
Want a coin that has a huge potential for massive returns? That coin is Battle Infinity.
Buy IBAT now.


Leave a Reply