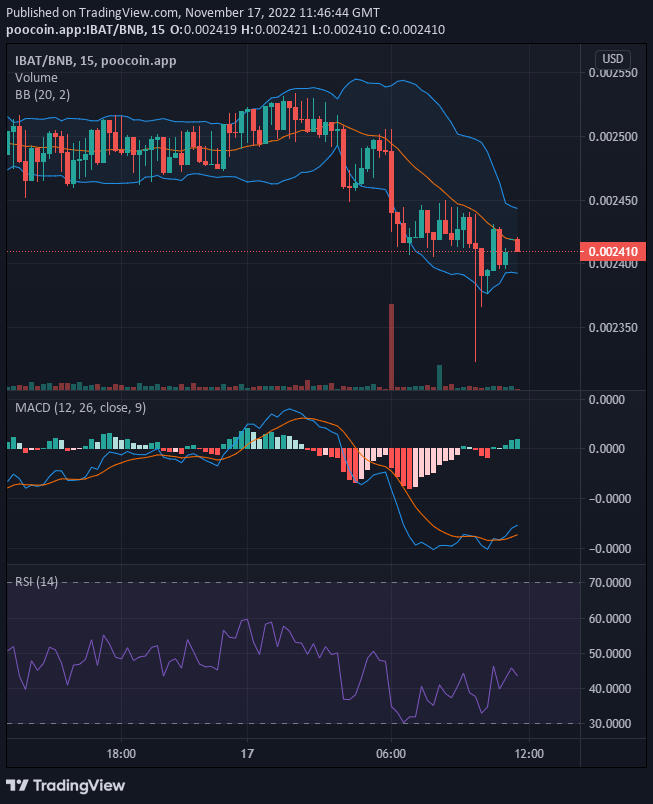
Towards the very end of the last daily session, Battle Infinity’s price came across a brick wall at $0.002526, and then the price nose-dived. It came below the $0.0024 support level. Bulls eventually were able to find support at $0.002390. From here the price rallies above $0.0024. And the bulls are ready for more actions
Key Levels
- Resistance: $0.0027, $0.0028, $0.0029
- Support: $0.0023, $0.0022 $0.0021
IBAT/USD: The Indicators’ Outlook
Although, in the MACD indicator, we have very bearish histograms, the two recent histograms which appear in faded red colour signify bullish activities as they make a price recovery attempts. The MACD line is now changing direction to the upside. The RSI line, though in the sell zone, is rising. The line now measures 38.

Battle Infinity Short-Term Outlook: Bullish Recovery (15-minute chart)
From this point of view, we see a bullish recovery in progress. The MACD line has crossed the signal line and we now have progressive bullish histograms. As the bullish price recovers, we notice that the Bollinger indicator is like forming a horizontally moving price channel. Both the upper band and the lower bands are now moving sideways. This may be due to the resistance level at $0.002442. But according to the RSI, the bullish momentum is increasing. And the resistance level will be broken soon. This is the time to invest.
Want a coin that has a huge potential for massive returns? That coin is Battle Infinity.
Buy IBAT now.


Leave a Reply