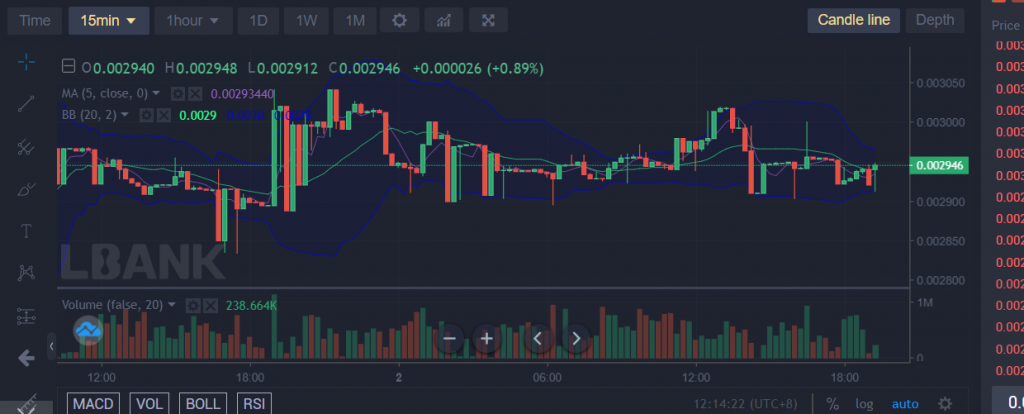
In the 23rd hour of the trading session on the 31st of October, Battle Infinity bulls formed strong support at $0.002938. This will be in an attempt to find a firm footing to break away from the market indecision. The bulls were so aggressive in that 23rd session of the 31s of October that they left almost no space for the bears in the market for that particular session. But the bears’ response in the following session did not allow the price to go beyond the $0.003021 price resistance level. However, bullish efforts were able to establish higher support for the price as the market progresses till today.
Key Levels
- Resistance: $0.0033, $0.0034, $0.0035
- Support: $0.0028, $0.0027, $0.0026
IBAT/USD: The Indicators’ Outlook
Although new higher supports were established, the resistance price level from 12 noon yesterday till now, remains unaffected by the bullish advances. At this point, Battle Infinity needs more bullish activities. The Bollinger indicator, however, offers a ray of hope as the bands are now converging at the center of the indicator’s moving average. This is like forming a symmetrical triangle candle pattern which will culminate into a price breakout. In this case, we expect a bullish breakout.
Battle Infinity Short-Term Outlook: Bullish Recovery (15-minute chart)
We are afforded the opportunity to see the struggle from this outlook. The struggle between demand and supply is intensifying. The bearish move is responsive to the bullish move. This makes the Bollinger indicator have an irregular pattern. The convergence of the Bollinger bands just took place by 1:30 am today. The price broke to the upside by 4:15 am, but the trend was lost due to bearish the response. Yet again, the bands are converging again for another bullish breakout.
Want a coin that has a huge potential for massive returns? That coin is Battle Infinity.
Buy IBAT now.


Leave a Reply