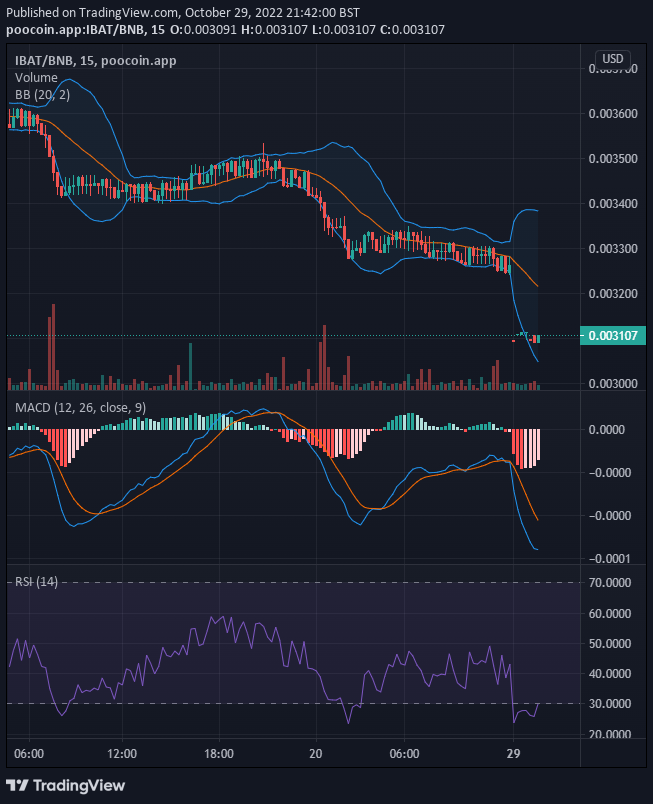
The Battle Infinity market broke out in favour of the sellers on the 19th of October. It was a very strong bearish market. But bulls were able to cut the trend short on the 20th of October. And because the selling pressure was strong, the bulls were only able to send the price into a consolidation period.
Key Levels
- Resistance: $0.0038, $0.0040, $0.0045
- Support: $0.0025, $0.0020, $0.0019
IBAT/USD: The Indicators’ Outlook
While the consolidation market continued from the 20th of October, the Bollinger bands tilted slightly in favour of the seller. However, the buyers are gathering momentum for bullish price performance. The price has advanced to the $0.003107 price level and the Bollinger band is widening out as the volume of trade increases.

IBAT/USD Short-Term Outlook: Bullish Recovery (15-minute chart)
The is a market price struggle at the current price but the bulls are winning. The Moving Average Convergence and Divergence show a bullish market recovery as its histograms are now appearing in faded red. Also, the height is progressively reducing in height. These faded red histograms will eventually culminate in green (positive) histograms.
Want a coin that has a huge potential for massive returns? That coin is Battle Infinity.
Buy IBAT now.


Leave a Reply