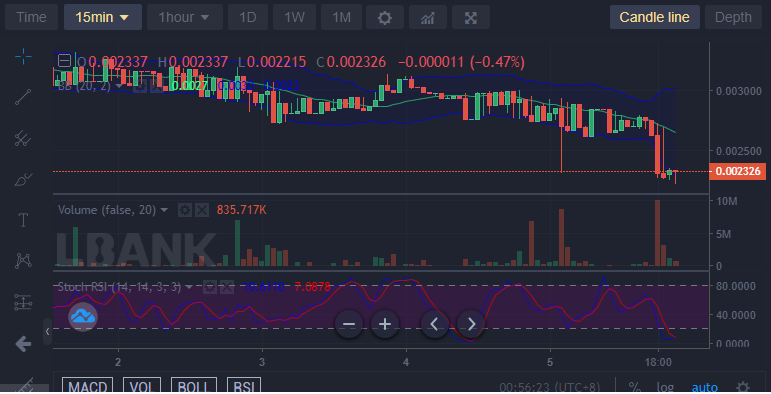
Already, we can see from the IBAT chart that buyers are beginning to come up in the market to recover their ground from the dip (low) of $0.002337 price level. The bullish and bearish movement seems very responsive to each other. The bearish move seems to respond to the bullish move. This makes the band of the Bollinger indicator grow very wide apart from each other.
Key Levels
Resistance: $0.003000, $0.00320, $0.003400
Support: $0.002000, $0.001900, $0.001800
IBAT/USD: The Indicators’ Outlook
At $0.002337, the price of Battle Infinity is in the oversold zone. In the RSI indicator (looking at the very recent hours as at the time this analysis is being written) the line is flat, moving at 0% market strength. Investors should be very alert and ready, at this point, to place their trade once the RSI line crosses the signal line in the oversold region. Also, looking at the Bollinger indicator, the chance for a bullish move is very likely as price action crosses below the lower band. It is expected that the candle will correct itself back within the bands of the indicator.

IBAT/USD Short-Term Outlook: Bullish Recovery (15-minute chart)
The RSI line is beginning to retrace an upper price level in the indicator of this particular outlook. The line has crossed the signal line in the oversold region. Therefore, it is sure that the bullish trend will follow this price dip.
Want a coin that has a huge potential for massive returns? That coin is Battle Infinity.
Buy IBAT now.


Leave a Reply