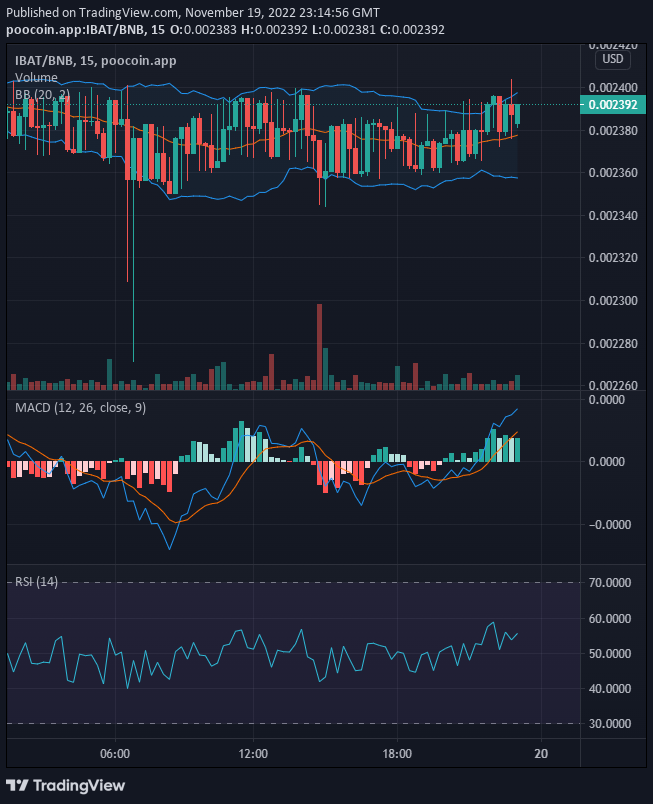
Battle Infinity bulls continue to maintain a firm grip around the $0.0024 price level despite the selling pressure. Bearish pressure was strong in the market. It was so strong that the bullish support had to shift slightly to a lower price level. However as the day’s session approaches the end, the support returns to where it was at the beginning of the day’s session.
Key Levels
- Resistance: $0.0027, $0.0028, $0.0029
- Support: $0.0023, $0.0022 $0.0021
IBAT/USD: The Indicators’ Outlook
As bulls continue to hold up against the bearish pressure, the upper and lower bands of the Bollinger indicator begin to contract against the price activities. This is a pointer to the intensifying struggle between demand and supply in the market. The MACD indicator, however, still carries a bullish sentiment. The MACD line is approaching the midpoint of the indicator in an attempt to cross out of the bullish zone thereby confirming the second stage of bullish recovery.

Battle Infinity Short-Term Outlook: Bullish Recovery (15-minute chart)
As the bullish support continues to hold against massive pressure at around $0.0024, the probability for a bullish price break out increases. A piece of information from the MACD suggests a bullish price. The two MACD lines and the histograms favour bullish sentiments The bullish momentum according to the RSI is around 55.9. The indicators portray the market as bullish. And these bullish activities will soon translate to the one-hour timeframe.
Want a coin that has a huge potential for massive returns? That coin is Battle Infinity.
Buy IBAT now.


Leave a Reply