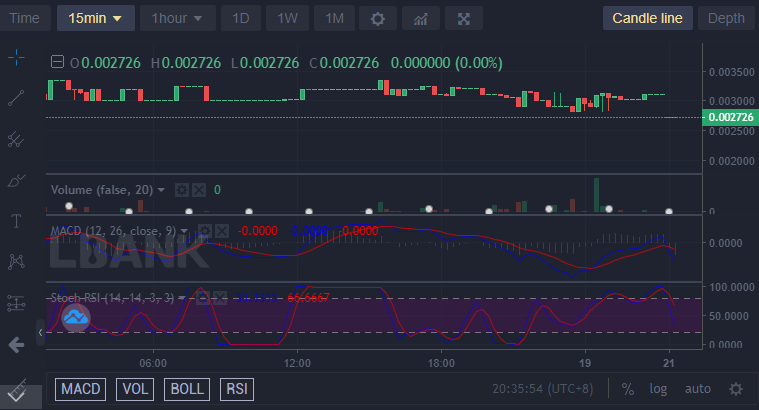
The price of IBAT/USD is preparing an upward performance as market momentums slows down into a sideway ranging market. The price consolidates as the bullish and bearish pressure in the market get even. After this the buying pressure is expected to increase.
Key Levels
Resistance: $0.003454, $0.003500, $0.003556
Support: $0.002500, $0.002231, $0.002000
IBAT/USD: The Indicators’ Outlook
When we look at the behaviour of the IBAT/USD market since the 15th of September, we will see how the market had maintained a regular oscillating line pattern till today. The support levels of the price actions are falling slightly along the line. But, the resistance levels are also making more lower lows. This lower lows are now taking tthe form of a falling wedge candlestick pattern which is highly significant of a bullish reversal trend. Buyers are not giving up ground to the sellers. They are holding up strongly and soon they will take the control of the market.

IBAT/USD Short-Term Outlook: Bullish Recovery (15-minute chart)
The shorter timeframe gives us the glimpse into the latest bullish moves that may not reflect into the bigger time frame. We can now see that the recent trading sessions are taken by the bulls. But they did not push the price up too much. The Relative Strength Index indicates that the price has already entered the overbought and it is retracing a lower price level. This retracement should not be for long as it is expected that the price will continue to trend upward.
Want a coin that has a huge potential for massive returns? That coin is Battle Infinity.
Buy IBAT now.


Leave a Reply